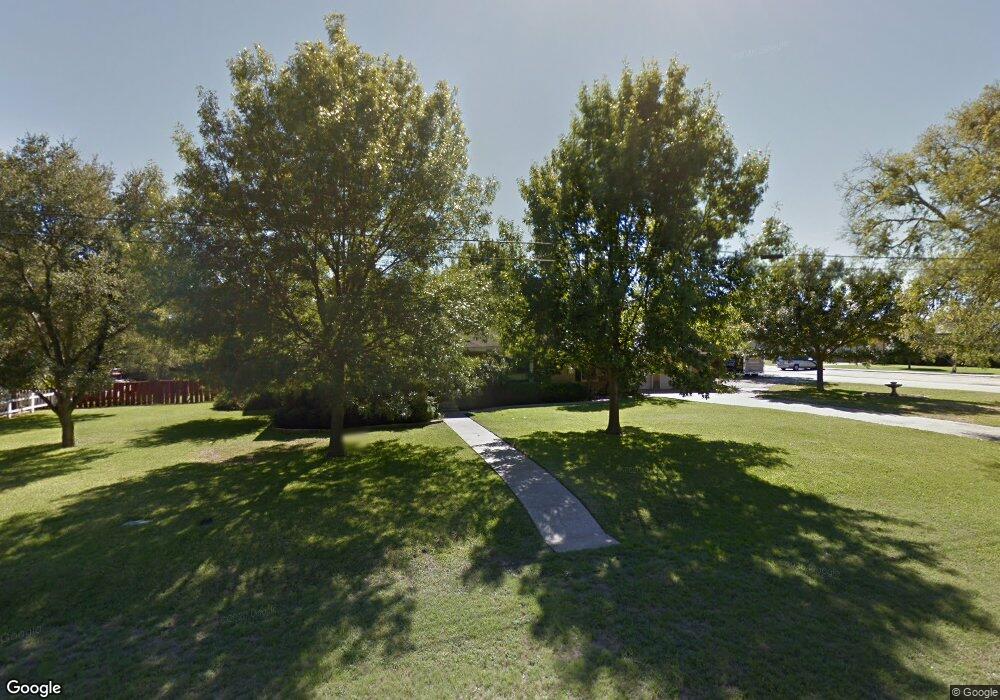
621 W 5th St Justin, TX 76247
Estimated Value: $361,637 - $399,000
3
Beds
2
Baths
2,286
Sq Ft
$165/Sq Ft
Est. Value
About This Home
This home is located at 621 W 5th St, Justin, TX 76247 and is currently estimated at $377,409, approximately $165 per square foot. 621 W 5th St is a home located in Denton County with nearby schools including Justin Elementary School, Gene Pike Middle School, and Northwest High School.
Ownership History
Date
Name
Owned For
Owner Type
Purchase Details
Closed on
Aug 3, 2020
Sold by
Rialto Investments Llc
Bought by
Sherrod Richard Seth and The Lisa Jo Mccaslin Revocable Trust
Current Estimated Value
Purchase Details
Closed on
Aug 28, 2015
Sold by
Schoenle August A
Bought by
Sherrod Richard S and Sherrod Hope
Home Financials for this Owner
Home Financials are based on the most recent Mortgage that was taken out on this home.
Original Mortgage
$180,500
Interest Rate
4.12%
Mortgage Type
New Conventional
Purchase Details
Closed on
Aug 10, 2007
Sold by
Young Sherman Howard and Young Lana Rhea
Bought by
Rosson Mary H
Home Financials for this Owner
Home Financials are based on the most recent Mortgage that was taken out on this home.
Original Mortgage
$150,000
Interest Rate
6.64%
Mortgage Type
Purchase Money Mortgage
Purchase Details
Closed on
Dec 10, 1993
Sold by
Holland Jerry T and Fuller Jerry H
Bought by
Young Howard
Create a Home Valuation Report for This Property
The Home Valuation Report is an in-depth analysis detailing your home's value as well as a comparison with similar homes in the area
Home Values in the Area
Average Home Value in this Area
Purchase History
| Date | Buyer | Sale Price | Title Company |
|---|---|---|---|
| Sherrod Richard Seth | -- | None Available | |
| Sherrod Richard S | -- | None Available | |
| Rosson Mary H | -- | Fatco | |
| Young Howard | -- | -- |
Source: Public Records
Mortgage History
| Date | Status | Borrower | Loan Amount |
|---|---|---|---|
| Previous Owner | Sherrod Richard S | $180,500 | |
| Previous Owner | Rosson Mary H | $150,000 |
Source: Public Records
Tax History Compared to Growth
Tax History
| Year | Tax Paid | Tax Assessment Tax Assessment Total Assessment is a certain percentage of the fair market value that is determined by local assessors to be the total taxable value of land and additions on the property. | Land | Improvement |
|---|---|---|---|---|
| 2025 | $7,456 | $324,695 | $121,761 | $202,934 |
| 2024 | $7,456 | $391,194 | $121,761 | $269,433 |
| 2023 | $5,420 | $341,672 | $121,761 | $282,269 |
| 2022 | $6,594 | $310,611 | $76,100 | $269,958 |
| 2021 | $6,611 | $282,374 | $48,704 | $233,670 |
| 2020 | $5,893 | $256,747 | $48,704 | $208,043 |
| 2019 | $5,928 | $250,611 | $48,704 | $204,380 |
| 2018 | $5,417 | $227,828 | $36,528 | $198,658 |
| 2017 | $4,890 | $207,116 | $39,572 | $179,084 |
| 2016 | $4,445 | $188,287 | $29,952 | $158,335 |
| 2015 | -- | $170,810 | $29,952 | $140,858 |
| 2013 | -- | $161,376 | $35,847 | $125,529 |
Source: Public Records
Map
Nearby Homes
- 603 N Denton Ave
- 418 W 4th St
- 518 Leuty St
- 416 W 3rd St
- 414 W 4th St
- 402 W 6th St
- 315 W 6th St
- 1009 W 7th St
- 208 W 4th St
- 207 W 7th St
- 217 Raveena Blvd
- 11575 Antrim Place
- 160 Sorrento Way
- 3-A Floor Plan at The Cottages of Old Town Justin
- 2-A Floor Plan at The Cottages of Old Town Justin
- 104 Northampton Dr
- 102 Hudson Ln
- 249 Pine Crest Dr
- 112 Northampton Dr
- 114 Northampton Dr