Estimated Value: $111,000 - $196,000
4
Beds
1
Bath
2,440
Sq Ft
$67/Sq Ft
Est. Value
About This Home
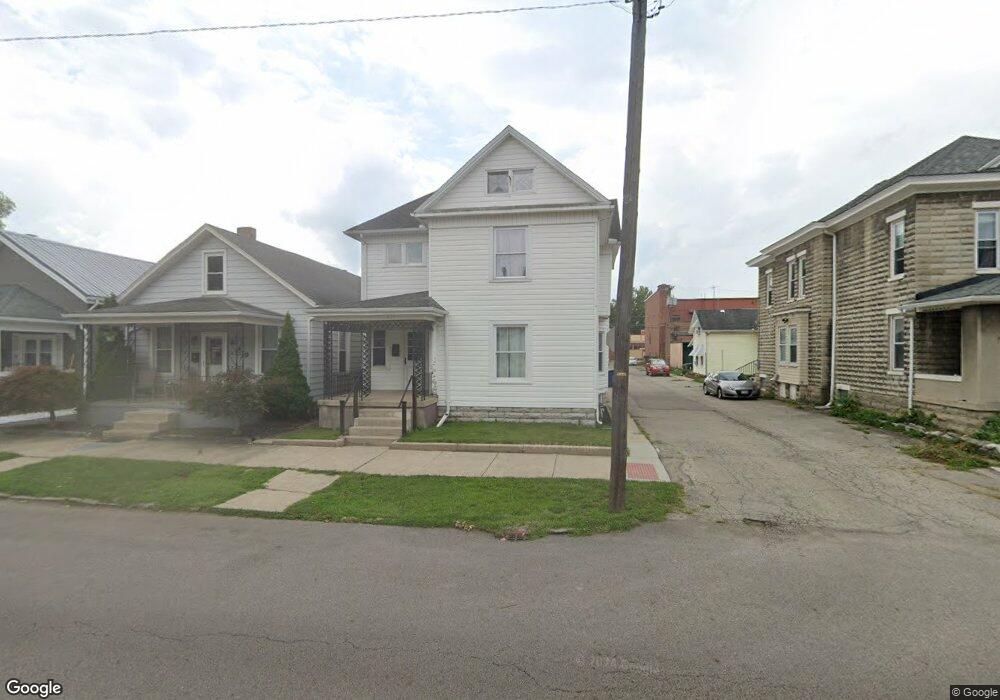
This home is located at 621 W Ash St, Piqua, OH 45356 and is currently estimated at $163,838, approximately $67 per square foot. 621 W Ash St is a home located in Miami County with nearby schools including Washington Primary School, Piqua Junior High School, and Piqua High School.
Ownership History
Date
Name
Owned For
Owner Type
Purchase Details
Closed on
Jun 18, 2015
Sold by
Fannie Mae
Bought by
Peltier Cynthia M
Current Estimated Value
Home Financials for this Owner
Home Financials are based on the most recent Mortgage that was taken out on this home.
Original Mortgage
$53,927
Outstanding Balance
$41,351
Interest Rate
3.87%
Mortgage Type
FHA
Estimated Equity
$122,487
Purchase Details
Closed on
Mar 10, 2015
Sold by
Benton Surman R
Bought by
Federal National Mortgage Association
Purchase Details
Closed on
Feb 25, 2015
Sold by
Benton Surman R
Bought by
Federal National Mortgage Association
Purchase Details
Closed on
Jan 1, 1990
Bought by
Hagan Mildred A
Create a Home Valuation Report for This Property
The Home Valuation Report is an in-depth analysis detailing your home's value as well as a comparison with similar homes in the area
Home Values in the Area
Average Home Value in this Area
Purchase History
| Date | Buyer | Sale Price | Title Company |
|---|---|---|---|
| Peltier Cynthia M | -- | Omega Title Agency Llc | |
| Federal National Mortgage Association | $88,428 | Attorney | |
| Federal National Mortgage Association | $88,428 | None Available | |
| Hagan Mildred A | -- | -- |
Source: Public Records
Mortgage History
| Date | Status | Borrower | Loan Amount |
|---|---|---|---|
| Open | Peltier Cynthia M | $53,927 |
Source: Public Records
Tax History
| Year | Tax Paid | Tax Assessment Tax Assessment Total Assessment is a certain percentage of the fair market value that is determined by local assessors to be the total taxable value of land and additions on the property. | Land | Improvement |
|---|---|---|---|---|
| 2025 | $1,857 | $52,610 | $5,110 | $47,500 |
| 2024 | $1,857 | $41,760 | $5,570 | $36,190 |
| 2023 | $1,716 | $41,760 | $5,570 | $36,190 |
| 2022 | $1,746 | $41,760 | $5,570 | $36,190 |
| 2021 | $1,468 | $32,100 | $4,270 | $27,830 |
| 2020 | $1,438 | $32,100 | $4,270 | $27,830 |
| 2019 | $1,446 | $32,100 | $4,270 | $27,830 |
| 2018 | $1,349 | $28,600 | $4,270 | $24,330 |
| 2017 | $1,366 | $28,600 | $4,270 | $24,330 |
| 2016 | $1,351 | $28,600 | $4,270 | $24,330 |
| 2015 | -- | $27,480 | $4,100 | $23,380 |
| 2014 | -- | $27,480 | $4,100 | $23,380 |
| 2013 | $1,333 | $27,480 | $4,100 | $23,380 |
Source: Public Records
Map
Nearby Homes
- 211 Franklin St
- 411 Virginia St
- 825 W Greene St
- 522 W North St
- 333 W Greene St
- 651 Boone St
- 630 Boone St
- 924 W North St
- 735 Park Ave
- 224 Gordon St
- 423 N Wayne St
- 651 N Downing St Unit 8
- 128 S Wayne St
- 615 N Wayne St
- 412 Camp St
- 113 Sherman St
- 908 Camp St
- 107 Riverside Dr
- 997 Covington Ave
- 512 Orr St
Your Personal Tour Guide
Ask me questions while you tour the home.