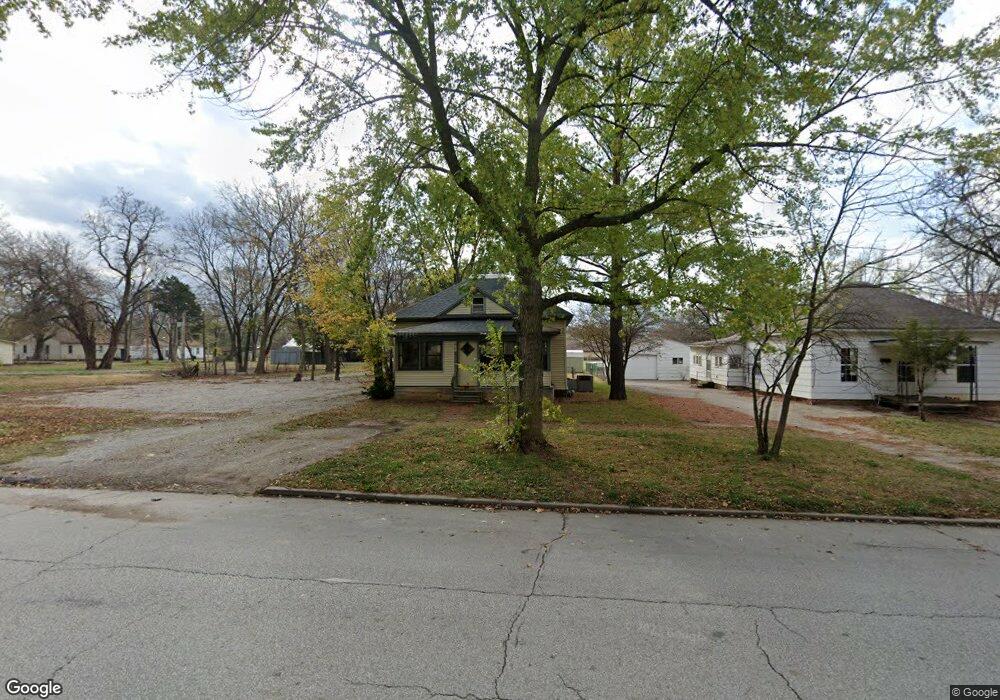
621 W Main St Cherryvale, KS 67335
Estimated Value: $66,922 - $105,000
3
Beds
2
Baths
1,514
Sq Ft
$57/Sq Ft
Est. Value
About This Home
This home is located at 621 W Main St, Cherryvale, KS 67335 and is currently estimated at $86,981, approximately $57 per square foot. 621 W Main St is a home located in Montgomery County.
Ownership History
Date
Name
Owned For
Owner Type
Purchase Details
Closed on
Sep 22, 2017
Bought by
Sun State Properties Llc
Current Estimated Value
Purchase Details
Closed on
Apr 25, 2008
Sold by
Secretary Of Housing And Urban Developme
Bought by
Ellison Michelle C
Home Financials for this Owner
Home Financials are based on the most recent Mortgage that was taken out on this home.
Original Mortgage
$20,400
Interest Rate
6.11%
Purchase Details
Closed on
Sep 27, 2007
Sold by
Secretary Of Housing And Urban Developme
Bought by
Veach Stanley R
Create a Home Valuation Report for This Property
The Home Valuation Report is an in-depth analysis detailing your home's value as well as a comparison with similar homes in the area
Purchase History
| Date | Buyer | Sale Price | Title Company |
|---|---|---|---|
| Sun State Properties Llc | -- | -- | |
| Ellison Michelle C | -- | -- | |
| Veach Stanley R | -- | -- |
Source: Public Records
Mortgage History
| Date | Status | Borrower | Loan Amount |
|---|---|---|---|
| Previous Owner | Ellison Michelle C | $20,400 |
Source: Public Records
Tax History
| Year | Tax Paid | Tax Assessment Tax Assessment Total Assessment is a certain percentage of the fair market value that is determined by local assessors to be the total taxable value of land and additions on the property. | Land | Improvement |
|---|---|---|---|---|
| 2025 | $439 | $2,948 | $849 | $2,099 |
| 2024 | $4 | $2,781 | $848 | $1,933 |
| 2023 | $410 | $2,623 | $844 | $1,779 |
| 2022 | $410 | $2,322 | $765 | $1,557 |
| 2021 | $0 | $3,073 | $475 | $2,598 |
| 2020 | $0 | $3,073 | $439 | $2,634 |
| 2019 | $637 | $3,145 | $474 | $2,671 |
| 2018 | $678 | $3,445 | $332 | $3,113 |
| 2017 | $760 | $3,890 | $332 | $3,558 |
| 2016 | $868 | $4,408 | $223 | $4,185 |
| 2015 | -- | $4,119 | $223 | $3,896 |
| 2014 | -- | $4,119 | $223 | $3,896 |
Source: Public Records
Map
Nearby Homes
- 729 W 3rd St
- 532 W 1st St
- 406 N Catherine St
- 401 W 1st St
- 329 W 1st St
- 218 E 5th St
- 300 E 3rd St
- 309 S Montgomery St
- 425 E 5th St
- 703 E 4th St
- 803 E 6th St
- 5501 Cr 5200
- 5305 County Road 5400
- 5305 Cr 5400 Rd
- 5122 Cr 4600 N A
- 4296 County Road 5100
- 6039 County Road 5375
- 406A 21000 Rd
- 406B 21000 Rd
- 318 15000 Rd
Your Personal Tour Guide
Ask me questions while you tour the home.