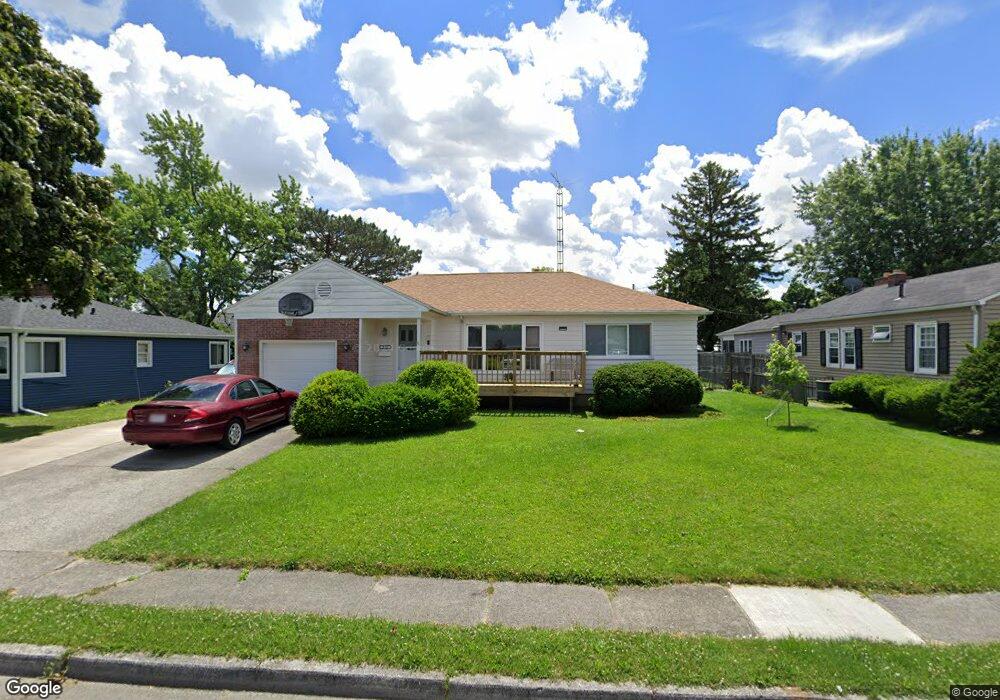
621 Westhaven Dr Fostoria, OH 44830
Estimated Value: $90,000 - $171,000
2
Beds
1
Bath
1,244
Sq Ft
$112/Sq Ft
Est. Value
About This Home
This home is located at 621 Westhaven Dr, Fostoria, OH 44830 and is currently estimated at $138,880, approximately $111 per square foot. 621 Westhaven Dr is a home located in Hancock County with nearby schools including Fostoria Intermediate Elementary School and Fostoria Junior/Senior High School.
Ownership History
Date
Name
Owned For
Owner Type
Purchase Details
Closed on
Oct 10, 2003
Sold by
Sanders Kevin R
Bought by
Roberts Jason W
Current Estimated Value
Home Financials for this Owner
Home Financials are based on the most recent Mortgage that was taken out on this home.
Original Mortgage
$87,000
Outstanding Balance
$41,377
Interest Rate
6.49%
Mortgage Type
Purchase Money Mortgage
Estimated Equity
$97,503
Purchase Details
Closed on
Nov 23, 1999
Sold by
Sanders Kevin R
Bought by
Sanders Kevin R
Purchase Details
Closed on
Aug 27, 1998
Sold by
Rose Evelyn
Bought by
Sanders Kevin and Swartz Jodi
Home Financials for this Owner
Home Financials are based on the most recent Mortgage that was taken out on this home.
Original Mortgage
$78,500
Interest Rate
7.03%
Mortgage Type
New Conventional
Purchase Details
Closed on
Jun 30, 1989
Bought by
Rose Evelyn A
Create a Home Valuation Report for This Property
The Home Valuation Report is an in-depth analysis detailing your home's value as well as a comparison with similar homes in the area
Home Values in the Area
Average Home Value in this Area
Purchase History
| Date | Buyer | Sale Price | Title Company |
|---|---|---|---|
| Roberts Jason W | $87,000 | -- | |
| Sanders Kevin R | $31,310 | -- | |
| Sanders Kevin | $78,500 | -- | |
| Rose Evelyn A | -- | -- |
Source: Public Records
Mortgage History
| Date | Status | Borrower | Loan Amount |
|---|---|---|---|
| Open | Roberts Jason W | $87,000 | |
| Previous Owner | Sanders Kevin | $78,500 |
Source: Public Records
Tax History Compared to Growth
Tax History
| Year | Tax Paid | Tax Assessment Tax Assessment Total Assessment is a certain percentage of the fair market value that is determined by local assessors to be the total taxable value of land and additions on the property. | Land | Improvement |
|---|---|---|---|---|
| 2024 | $2,015 | $40,480 | $5,510 | $34,970 |
| 2023 | $2,010 | $40,480 | $5,510 | $34,970 |
| 2022 | $2,190 | $40,480 | $5,510 | $34,970 |
| 2021 | $1,881 | $33,460 | $5,520 | $27,940 |
| 2020 | $1,890 | $33,460 | $5,520 | $27,940 |
| 2019 | $1,881 | $33,460 | $5,520 | $27,940 |
| 2018 | $1,678 | $29,100 | $4,800 | $24,300 |
| 2017 | $838 | $29,100 | $4,800 | $24,300 |
| 2016 | $1,474 | $29,100 | $4,800 | $24,300 |
| 2015 | $1,339 | $26,550 | $5,240 | $21,310 |
| 2014 | $1,337 | $26,520 | $5,240 | $21,280 |
| 2012 | $1,580 | $31,190 | $5,240 | $25,950 |
Source: Public Records
Map
Nearby Homes
- 603 N Vine St
- 901 Central Ave
- 727 Eisenhower Dr
- 892 N Countyline St
- 900 N Countyline St
- 723 N Union St
- 931 N Union St
- 509 College Ave
- 520 N Union St
- 207 W Culbertson St
- 375 Thomas St
- 634 W Tiffin St
- 203 N Union St
- 1324 N Union St
- 425 W Ridge Dr Unit U5
- 411 Monticello Dr
- 633 Maple St
- 1401 Van Buren St Unit U24
- 348 W South St
- 351 W South St
- 820 Elmhurst Dr
- 619 Westhaven Dr
- 636 Summit St
- 630 Summit St
- 804 Elmhurst Dr
- 620 Westhaven Dr
- 821 Elmhurst Dr
- 628 Westhaven Dr
- 624 Summit St
- 618 Westhaven Dr
- 630 Westhaven Dr
- 605 Westhaven Dr
- 620 Summit St
- 640 Summit St
- 629 Westhaven Dr
- 601 Westhaven Dr
- 612 Summit St
- 809 N Vine St
- 632 Westhaven Dr
- 642 Summit St