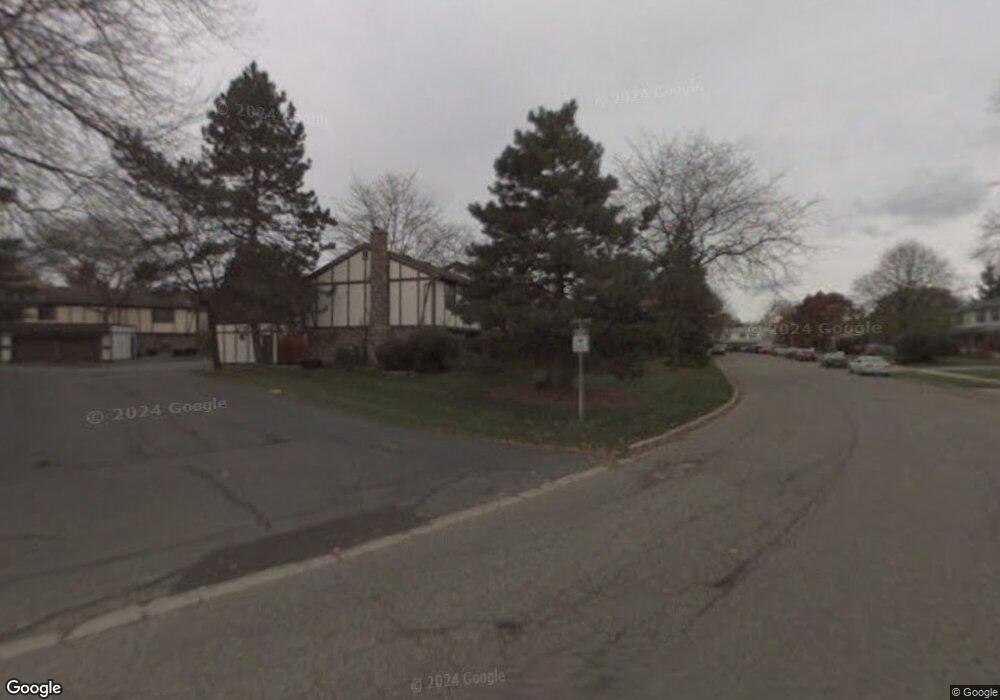
6210 Captains Way Unit 11 East Lansing, MI 48823
Estimated Value: $185,000 - $200,787
3
Beds
2
Baths
1,392
Sq Ft
$137/Sq Ft
Est. Value
About This Home
This home is located at 6210 Captains Way Unit 11, East Lansing, MI 48823 and is currently estimated at $191,197, approximately $137 per square foot. 6210 Captains Way Unit 11 is a home located in Ingham County with nearby schools including Donley Elementary School, MacDonald Middle School, and East Lansing High School.
Ownership History
Date
Name
Owned For
Owner Type
Purchase Details
Closed on
May 9, 2022
Sold by
Vardanova Asya
Bought by
Titov And Vardanova Family Trust and Titov
Current Estimated Value
Purchase Details
Closed on
Jul 28, 2003
Sold by
Union Federal Bank Of Indianapolis
Bought by
Va
Purchase Details
Closed on
Jul 3, 2003
Sold by
Ennis Timothy Scott and Peck Rachelle Lea
Bought by
Union Federal Bank Of Indianapolis and Union Fsb Of Indianapolis
Purchase Details
Closed on
Sep 30, 1997
Sold by
Gaffey David and Gaffey Shay
Bought by
Ennis Timothy Scott
Purchase Details
Closed on
Jul 1, 1987
Create a Home Valuation Report for This Property
The Home Valuation Report is an in-depth analysis detailing your home's value as well as a comparison with similar homes in the area
Home Values in the Area
Average Home Value in this Area
Purchase History
| Date | Buyer | Sale Price | Title Company |
|---|---|---|---|
| Titov And Vardanova Family Trust | -- | None Listed On Document | |
| Va | -- | -- | |
| Union Federal Bank Of Indianapolis | $100,028 | -- | |
| Ennis Timothy Scott | $115,000 | -- | |
| -- | $59,800 | -- |
Source: Public Records
Tax History Compared to Growth
Tax History
| Year | Tax Paid | Tax Assessment Tax Assessment Total Assessment is a certain percentage of the fair market value that is determined by local assessors to be the total taxable value of land and additions on the property. | Land | Improvement |
|---|---|---|---|---|
| 2025 | $4,305 | $92,700 | $0 | $92,700 |
| 2024 | $27 | $85,300 | $0 | $85,300 |
| 2023 | $4,081 | $74,100 | $0 | $74,100 |
| 2022 | $3,927 | $69,100 | $0 | $69,100 |
| 2021 | $3,825 | $65,300 | $0 | $65,300 |
| 2020 | $3,785 | $62,300 | $0 | $62,300 |
| 2019 | $3,599 | $60,600 | $0 | $60,600 |
| 2018 | $3,500 | $59,600 | $0 | $59,600 |
| 2017 | $3,354 | $59,200 | $0 | $59,200 |
| 2016 | $2,213 | $54,200 | $0 | $54,200 |
| 2015 | $2,213 | $48,600 | $0 | $0 |
| 2014 | $2,213 | $47,900 | $0 | $0 |
Source: Public Records
Map
Nearby Homes
- 6160 Innkeepers Ct Unit 57
- 6165 Innkeepers Ct Unit 76
- 3021 Birch Row Dr Unit 9
- 6327 Skyline Dr
- 0 Birch Row Dr
- 6004 Gibson Ave
- 0 Hagadorn Lot C Rd Unit 50193276
- 5900 N Hagadorn Rd
- 0 Hagadorn Lot D Rd
- 1531 Winchell Ct
- 1539 N Hagadorn Rd Unit 1A
- 6315 Porter Ave
- 6031 Rutherford Ave
- 6343 Towar Ave
- 1511 Dennison Rd
- 1351 Foxcroft Rd
- 16736 Towar Ave
- 6097 Southridge Rd
- 1544 Haslett Rd
- 6381 Pine Hollow Dr
- 6212 Captains Way
- 6212 Captains Way Unit 10
- 6208 Captains Way
- 6208 Captains Way Unit 14
- 6214 Captains Way
- 6216 Captains Way
- 6218 Captains Way Unit 7
- 6193 Captains Way
- 6190 Captains Way Unit 13
- 6220 Captains Way Unit 6
- 6220 Captains Way
- 6191 Captains Way Unit 19
- 6188 Captains Way Unit 14
- 6189 Captains Way Unit 18
- 6222 Captains Way
- 6186 Captains Way Unit 15
- 6180 Birch Row Dr
- 6187 Captains Way
- 6224 Captains Way Unit 4