6210 Wilshire Pines Cir Unit 1-103 Naples, FL 34109
Wilshire Lakes NeighborhoodEstimated Value: $338,769 - $404,000
3
Beds
2
Baths
1,427
Sq Ft
$257/Sq Ft
Est. Value
About This Home
This home is located at 6210 Wilshire Pines Cir Unit 1-103, Naples, FL 34109 and is currently estimated at $366,692, approximately $256 per square foot. 6210 Wilshire Pines Cir Unit 1-103 is a home located in Collier County with nearby schools including Vineyards Elementary School, North Naples Middle School, and First Baptist Academy.
Ownership History
Date
Name
Owned For
Owner Type
Purchase Details
Closed on
Sep 9, 2015
Sold by
Lee Joan J and Kudner Donald
Bought by
Campbell Diana Clark and Reed Kimberly
Current Estimated Value
Home Financials for this Owner
Home Financials are based on the most recent Mortgage that was taken out on this home.
Original Mortgage
$109,000
Outstanding Balance
$85,933
Interest Rate
4.02%
Mortgage Type
New Conventional
Estimated Equity
$280,759
Purchase Details
Closed on
Sep 1, 2015
Bought by
Diana
Home Financials for this Owner
Home Financials are based on the most recent Mortgage that was taken out on this home.
Original Mortgage
$109,000
Outstanding Balance
$85,933
Interest Rate
4.02%
Mortgage Type
New Conventional
Estimated Equity
$280,759
Purchase Details
Closed on
Aug 2, 2007
Sold by
Lee Paul and Lee Joan
Bought by
Lee Paul and Lee Joan J
Purchase Details
Closed on
Oct 19, 2004
Sold by
Meister Wolfgang and Meister Judith
Bought by
Lee Paul and Lee Joan
Create a Home Valuation Report for This Property
The Home Valuation Report is an in-depth analysis detailing your home's value as well as a comparison with similar homes in the area
Home Values in the Area
Average Home Value in this Area
Purchase History
| Date | Buyer | Sale Price | Title Company |
|---|---|---|---|
| Campbell Diana Clark | $184,300 | Attorney | |
| Diana | $100 | -- | |
| Lee Paul | -- | Attorney | |
| Lee Paul | $215,000 | -- |
Source: Public Records
Mortgage History
| Date | Status | Borrower | Loan Amount |
|---|---|---|---|
| Open | Campbell Diana Clark | $109,000 |
Source: Public Records
Tax History Compared to Growth
Tax History
| Year | Tax Paid | Tax Assessment Tax Assessment Total Assessment is a certain percentage of the fair market value that is determined by local assessors to be the total taxable value of land and additions on the property. | Land | Improvement |
|---|---|---|---|---|
| 2025 | $1,475 | $203,625 | -- | -- |
| 2024 | $1,453 | $197,886 | -- | -- |
| 2023 | $1,453 | $192,122 | $0 | $0 |
| 2022 | $1,535 | $186,526 | $0 | $0 |
| 2021 | $1,548 | $181,093 | $0 | $181,093 |
| 2020 | $1,882 | $174,138 | $0 | $174,138 |
| 2019 | $1,881 | $172,747 | $0 | $172,747 |
| 2018 | $1,327 | $160,954 | $0 | $0 |
| 2017 | $1,302 | $157,643 | $0 | $0 |
| 2016 | $1,049 | $154,401 | $0 | $0 |
| 2015 | $1,547 | $139,100 | $0 | $0 |
| 2014 | $1,464 | $130,059 | $0 | $0 |
Source: Public Records
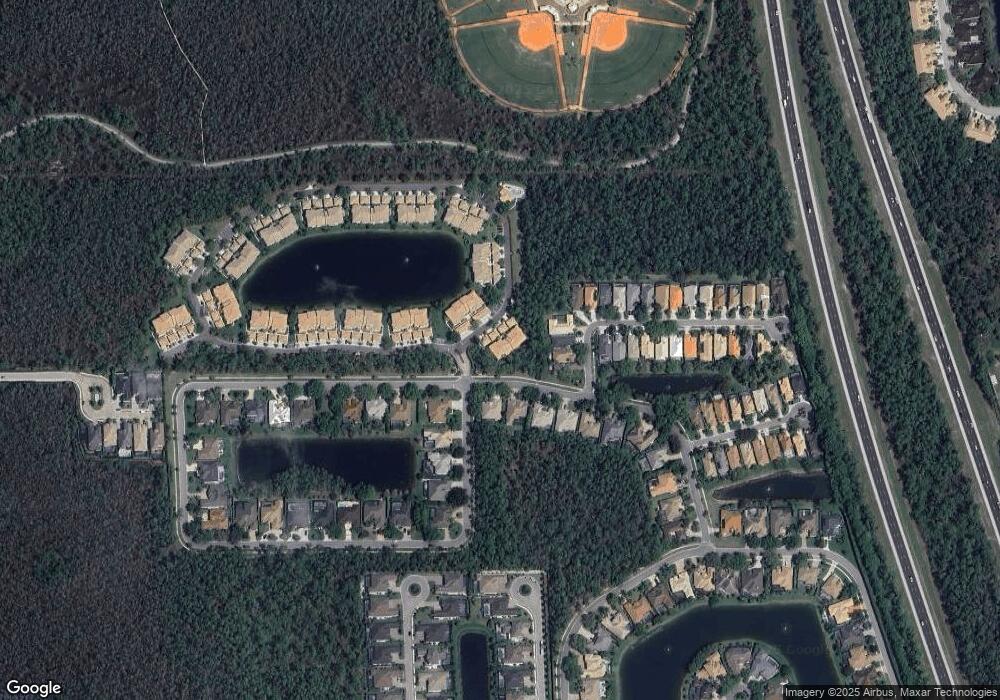
Map
Nearby Homes
- 9833 Clear Lake Cir
- 6225 Wilshire Pines Cir Unit 1504
- 6225 Wilshire Pines Cir Unit 1507
- 6235 Wilshire Pines Cir Unit 1404
- 14661 Liesl Ct E
- 6275 Wilshire Pines Cir Unit 1008
- 5012 Fairhaven Ln
- 9754 Wilshire Lakes Blvd
- 14690 Reserve Place
- 4009 Treadwater Ct
- 1757 Tarpon Bay Dr S Unit 57
- 1661 Tarpon Bay Dr S Unit 32
- 1760 Tarpon Bay Dr S Unit 102
- 1786 Tarpon Bay Dr S Unit I102
- 1630 Tarpon Bay Dr S Unit 201
- 1630 Tarpon Bay Dr S Unit 102
- 6210 Wilshire Pines Cir Unit 1-102
- 6210 Wilshire Pines Cir Unit 106
- 6210 Wilshire Pines Cir Unit 101
- 6210 Wilshire Pines Cir Unit 105
- 6210 Wilshire Pines Cir Unit 102
- 6210 Wilshire Pines Cir Unit 1-107
- 6210 Wilshire Pines Cir Unit 104
- 6210 Wilshire Pines Cir Unit 1-108
- 6210 Wilshire Pines Cir
- 6210 Wilshire Pines Cir
- 6210 Wilshire Pines Cir Unit 1-106
- 6210 Wilshire Pines Cir Unit 107
- 6210 Wilshire Pines Cir Unit 103
- 6210 Wilshire Pines Cir Unit 1-101
- 6210 Wilshire Pines Cir Unit 108
- 6210 Wilshire Pines Cir
- 6210 Wilshire Pns Cir Unit 106
- 6210 Wilshire Pns Cir Unit 105
- 6210 Wilshire Pns Cir Unit 104
- 6210 Wilshire Pns Cir Unit 103