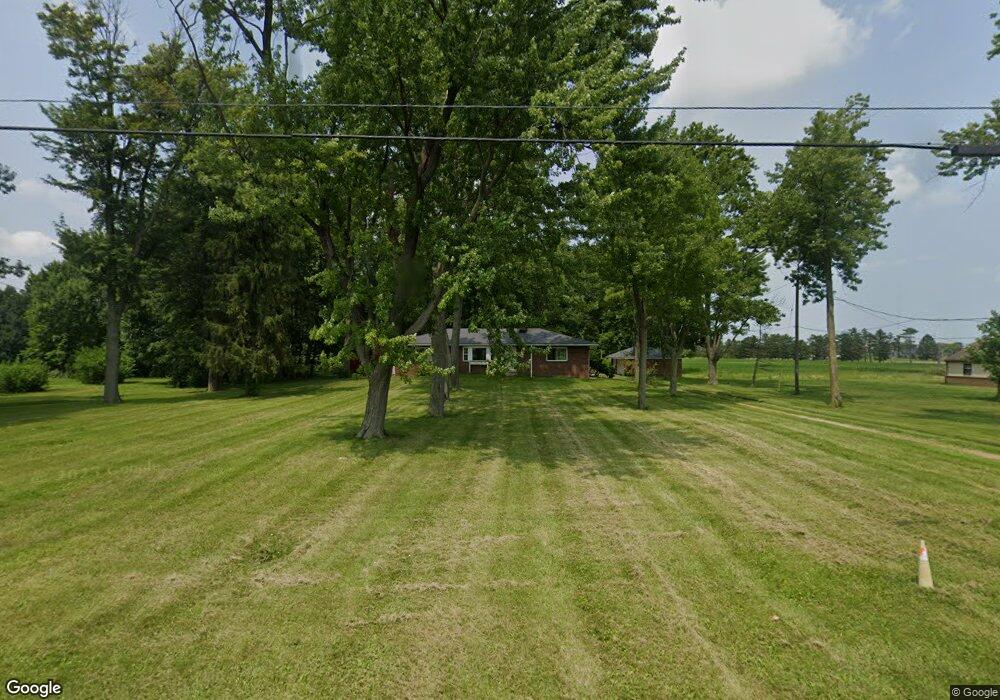
6211 Seaman Rd Oregon, OH 43616
Estimated Value: $264,000 - $355,746
3
Beds
2
Baths
1,905
Sq Ft
$160/Sq Ft
Est. Value
About This Home
This home is located at 6211 Seaman Rd, Oregon, OH 43616 and is currently estimated at $305,187, approximately $160 per square foot. 6211 Seaman Rd is a home located in Lucas County.
Ownership History
Date
Name
Owned For
Owner Type
Purchase Details
Closed on
Dec 8, 2014
Sold by
Boros Teri L and Hamer Teri L
Bought by
Boros William A
Current Estimated Value
Purchase Details
Closed on
Jul 18, 2001
Sold by
Boros Bert J Co Tr and William A
Bought by
Boros William A
Home Financials for this Owner
Home Financials are based on the most recent Mortgage that was taken out on this home.
Original Mortgage
$80,000
Outstanding Balance
$29,798
Interest Rate
7.16%
Estimated Equity
$275,389
Purchase Details
Closed on
Jul 17, 2001
Sold by
Boros William A
Bought by
Boros William A and Boros Teri L
Home Financials for this Owner
Home Financials are based on the most recent Mortgage that was taken out on this home.
Original Mortgage
$80,000
Outstanding Balance
$29,798
Interest Rate
7.16%
Estimated Equity
$275,389
Purchase Details
Closed on
Apr 16, 2001
Sold by
Mcmahon John W
Bought by
Lindsey Benjamin A and Boros William A
Purchase Details
Closed on
Dec 19, 1990
Sold by
Boros Luise K
Create a Home Valuation Report for This Property
The Home Valuation Report is an in-depth analysis detailing your home's value as well as a comparison with similar homes in the area
Home Values in the Area
Average Home Value in this Area
Purchase History
| Date | Buyer | Sale Price | Title Company |
|---|---|---|---|
| Boros William A | -- | None Available | |
| Boros William A | -- | Northwest Title Agency Of Oh | |
| Boros William A | -- | Northwest Title Agency Of Oh | |
| Lindsey Benjamin A | $10,000 | -- | |
| -- | -- | -- |
Source: Public Records
Mortgage History
| Date | Status | Borrower | Loan Amount |
|---|---|---|---|
| Open | Boros William A | $80,000 |
Source: Public Records
Tax History
| Year | Tax Paid | Tax Assessment Tax Assessment Total Assessment is a certain percentage of the fair market value that is determined by local assessors to be the total taxable value of land and additions on the property. | Land | Improvement |
|---|---|---|---|---|
| 2025 | -- | $91,070 | $28,875 | $62,195 |
| 2024 | $4,890 | $91,070 | $28,875 | $62,195 |
| 2023 | $4,199 | $83,545 | $34,160 | $49,385 |
| 2022 | $5,089 | $83,545 | $34,160 | $49,385 |
| 2021 | $5,123 | $83,545 | $34,160 | $49,385 |
| 2020 | $4,713 | $68,740 | $27,965 | $40,775 |
| 2019 | $5,136 | $68,740 | $27,965 | $40,775 |
| 2018 | $5,175 | $68,740 | $27,965 | $40,775 |
| 2017 | $11,680 | $67,165 | $27,335 | $39,830 |
| 2016 | $9,250 | $191,900 | $78,100 | $113,800 |
| 2015 | $6,069 | $191,900 | $78,100 | $113,800 |
| 2014 | $4,948 | $65,870 | $26,810 | $39,060 |
| 2013 | $4,059 | $65,870 | $26,810 | $39,060 |
Source: Public Records
Map
Nearby Homes
Your Personal Tour Guide
Ask me questions while you tour the home.