Preston Tower Condominiums 6211 W Northwest Hwy Unit G715 Dallas, TX 75225
Preston Hollow NeighborhoodEstimated Value: $782,004 - $982,000
3
Beds
4
Baths
2,855
Sq Ft
$292/Sq Ft
Est. Value
About This Home
This home is located at 6211 W Northwest Hwy Unit G715, Dallas, TX 75225 and is currently estimated at $834,251, approximately $292 per square foot. 6211 W Northwest Hwy Unit G715 is a home located in Dallas County with nearby schools including Benjamin Franklin International Exploratory Academy, Hillcrest High School, and Christ the King Catholic School.
Ownership History
Date
Name
Owned For
Owner Type
Purchase Details
Closed on
Oct 8, 2025
Sold by
Opsahl Tom and Opsahl Deborah
Bought by
Bowles 2013 Family Trust and Bowles
Current Estimated Value
Purchase Details
Closed on
Jun 29, 2018
Sold by
Conard Scott E and Conard Susan K
Bought by
Opsahl Tom and Opsahl Deborah
Purchase Details
Closed on
Aug 1, 2012
Sold by
Wignall David A and Wignall Ronald
Bought by
Conard Scott E and Conard Susan K
Purchase Details
Closed on
Dec 20, 2002
Sold by
Wignall Ronald A
Bought by
Wignall David A
Purchase Details
Closed on
Sep 15, 1995
Sold by
Payton Ella Mae Brown Boyles
Bought by
Wignall David A and Wignall Ronald A
Home Financials for this Owner
Home Financials are based on the most recent Mortgage that was taken out on this home.
Original Mortgage
$52,400
Interest Rate
7.77%
Create a Home Valuation Report for This Property
The Home Valuation Report is an in-depth analysis detailing your home's value as well as a comparison with similar homes in the area
Home Values in the Area
Average Home Value in this Area
Purchase History
| Date | Buyer | Sale Price | Title Company |
|---|---|---|---|
| Bowles 2013 Family Trust | -- | None Listed On Document | |
| Opsahl Tom | -- | Freedom Title | |
| Conard Scott E | -- | Freedom Title | |
| Conard Scott E | -- | Fatco | |
| Wignall David A | -- | -- | |
| Wignall David A | -- | -- |
Source: Public Records
Mortgage History
| Date | Status | Borrower | Loan Amount |
|---|---|---|---|
| Previous Owner | Wignall David A | $52,400 |
Source: Public Records
Tax History Compared to Growth
Tax History
| Year | Tax Paid | Tax Assessment Tax Assessment Total Assessment is a certain percentage of the fair market value that is determined by local assessors to be the total taxable value of land and additions on the property. | Land | Improvement |
|---|---|---|---|---|
| 2025 | $8,468 | $756,580 | $192,470 | $564,110 |
| 2024 | $8,468 | $685,200 | $192,470 | $492,730 |
| 2023 | $8,468 | $585,280 | $76,990 | $508,290 |
| 2022 | $14,634 | $585,280 | $76,990 | $508,290 |
| 2021 | $15,440 | $585,280 | $76,990 | $508,290 |
| 2020 | $15,878 | $585,280 | $76,990 | $508,290 |
| 2019 | $16,502 | $580,000 | $76,990 | $503,010 |
| 2018 | $19,408 | $713,750 | $76,990 | $636,760 |
| 2017 | $15,915 | $585,280 | $76,990 | $508,290 |
| 2016 | $14,751 | $542,450 | $24,640 | $517,810 |
| 2015 | $10,964 | $404,430 | $24,640 | $379,790 |
| 2014 | $10,964 | $399,700 | $24,640 | $375,060 |
Source: Public Records
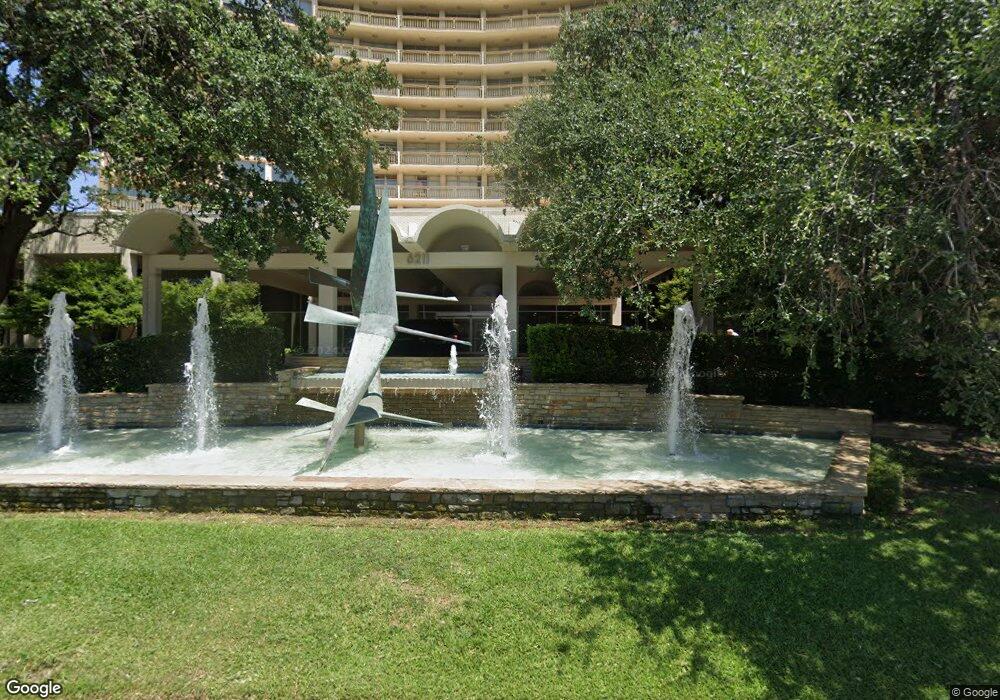
About Preston Tower Condominiums
Map
Nearby Homes
- 6211 W Northwest Hwy Unit 2005
- 6211 W Northwest Hwy Unit 700
- 6211 W Northwest Hwy Unit G710
- 6211 W Northwest Hwy Unit G224
- 6211 W Northwest Hwy Unit G514
- 6211 W Northwest Hwy Unit 2801
- 6211 W Northwest Hwy Unit 2306
- 6211 W Northwest Hwy Unit 500
- 6211 W NW Unit 701
- 6144 Averill Way Unit 203E
- 6126 Averill Way Unit 203 W
- 6126 Averill Way Unit 103W
- 6230 Bandera Ave Unit A
- 6130 Bandera Ave Unit C
- 6130 Bandera Ave Unit D
- 6227 Bandera Ave Unit D
- 6235 Bandera Ave Unit D
- 6151 Bandera Ave Unit B
- 6070 Averill Way Unit A
- 3829 Northwest Pkwy
- 6211 W Northwest Hwy Unit G103
- 6211 W Northwest Hwy Unit G408
- 6211 W Northwest Hwy Unit G508
- 6211 W Northwest Hwy Unit G110
- 6211 W Northwest Hwy Unit G212
- 6211 W Northwest Hwy Unit G223
- 6211 W Northwest Hwy Unit G106
- 6211 W Northwest Hwy Unit G510
- 6211 W Northwest Hwy Unit G714
- 6211 W Northwest Hwy Unit G513
- 6211 W Northwest Hwy Unit G717
- 6211 W Northwest Hwy Unit G716
- 6211 W Northwest Hwy Unit G712
- 6211 W Northwest Hwy Unit G708
- 6211 W Northwest Hwy Unit G517
- 6211 W Northwest Hwy Unit G516
- 6211 W Northwest Hwy Unit G515
- 6211 W Northwest Hwy Unit G512
- 6211 W Northwest Hwy Unit G511
- 6211 W Northwest Hwy Unit G509