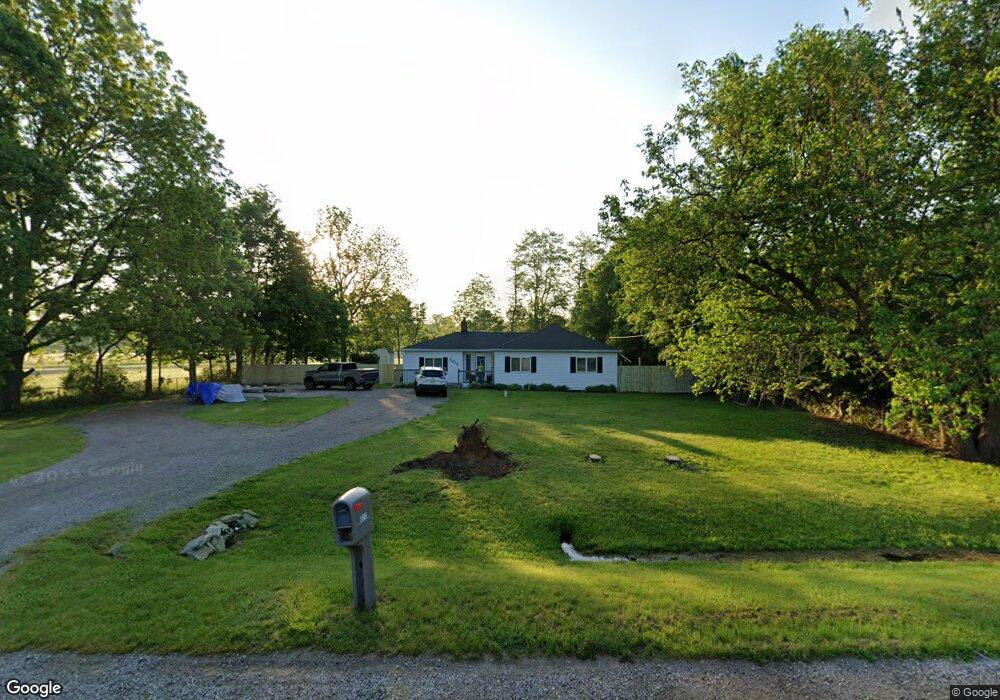
6212 N Bray Rd Mount Morris, MI 48458
Estimated Value: $140,000 - $215,000
3
Beds
2
Baths
1,382
Sq Ft
$127/Sq Ft
Est. Value
About This Home
This home is located at 6212 N Bray Rd, Mount Morris, MI 48458 and is currently estimated at $175,108, approximately $126 per square foot. 6212 N Bray Rd is a home located in Genesee County with nearby schools including Weston Elementary School, Leota Fiedler Elementary School, and Kate Dowdall Elementary School.
Ownership History
Date
Name
Owned For
Owner Type
Purchase Details
Closed on
Sep 18, 2018
Sold by
Dodge Varna Limited Liability Company
Bought by
Clear Steven J and Clear Tamara J
Current Estimated Value
Home Financials for this Owner
Home Financials are based on the most recent Mortgage that was taken out on this home.
Original Mortgage
$88,271
Outstanding Balance
$77,423
Interest Rate
4.87%
Mortgage Type
FHA
Estimated Equity
$97,685
Purchase Details
Closed on
Mar 6, 2009
Sold by
Mortgage Electronic Registration Systems
Bought by
Us Bank National Association
Purchase Details
Closed on
May 14, 2008
Sold by
Leach Laureen and Leach Craig
Bought by
Mortgage Electronic Registration Systems
Purchase Details
Closed on
Jul 20, 2005
Sold by
Spencer Donald L and Spencer Rebecca
Bought by
Leach Laureen
Purchase Details
Closed on
Aug 3, 2001
Sold by
Monroe Charles T and Monroe Amy L
Bought by
Spencer Donald L and Spencer Rebecca
Create a Home Valuation Report for This Property
The Home Valuation Report is an in-depth analysis detailing your home's value as well as a comparison with similar homes in the area
Home Values in the Area
Average Home Value in this Area
Purchase History
| Date | Buyer | Sale Price | Title Company |
|---|---|---|---|
| Clear Steven J | $89,900 | Sargents Title Co | |
| Us Bank National Association | -- | None Available | |
| Mortgage Electronic Registration Systems | $110,425 | None Available | |
| Leach Laureen | $120,000 | Metropolitan Title Company | |
| Spencer Donald L | $90,000 | Metropolitan Title Company |
Source: Public Records
Mortgage History
| Date | Status | Borrower | Loan Amount |
|---|---|---|---|
| Open | Clear Steven J | $88,271 |
Source: Public Records
Tax History Compared to Growth
Tax History
| Year | Tax Paid | Tax Assessment Tax Assessment Total Assessment is a certain percentage of the fair market value that is determined by local assessors to be the total taxable value of land and additions on the property. | Land | Improvement |
|---|---|---|---|---|
| 2025 | $1,924 | $70,500 | $0 | $0 |
| 2024 | $533 | $67,400 | $0 | $0 |
| 2023 | $508 | $60,400 | $0 | $0 |
| 2022 | $1,576 | $54,400 | $0 | $0 |
| 2021 | $1,562 | $46,500 | $0 | $0 |
| 2020 | $465 | $42,000 | $0 | $0 |
| 2019 | $457 | $39,400 | $0 | $0 |
| 2018 | $1,169 | $34,900 | $0 | $0 |
| 2017 | $1,649 | $34,600 | $0 | $0 |
| 2016 | $1,635 | $32,700 | $0 | $0 |
| 2015 | $1,490 | $31,100 | $0 | $0 |
| 2014 | $325 | $28,400 | $0 | $0 |
| 2012 | -- | $30,100 | $30,100 | $0 |
Source: Public Records
Map
Nearby Homes
- 2135 E Coldwater Rd
- 7164 N Bray Rd
- 6086 Lewis Rd
- 0 E Stanley Rd Unit 50168578
- 0 E Stanley Rd Unit 50134069
- 7306 N Bray Rd
- 7010 Lewis Rd
- 1404 E Kurtz Ave
- 5400 N Center Rd
- 7174 N Center Rd
- 5462 Harry St
- 7047 Birchwood Dr
- 1320 E Cornell Ave
- 3499 E Carpenter Rd
- 1145 Laport Ave
- 1134 Dowagiac Ave
- 1116 Morris Hills Pkwy
- 4418 Branch Rd
- 1463 Ida Ct
- 1133 Dunkirk Ave