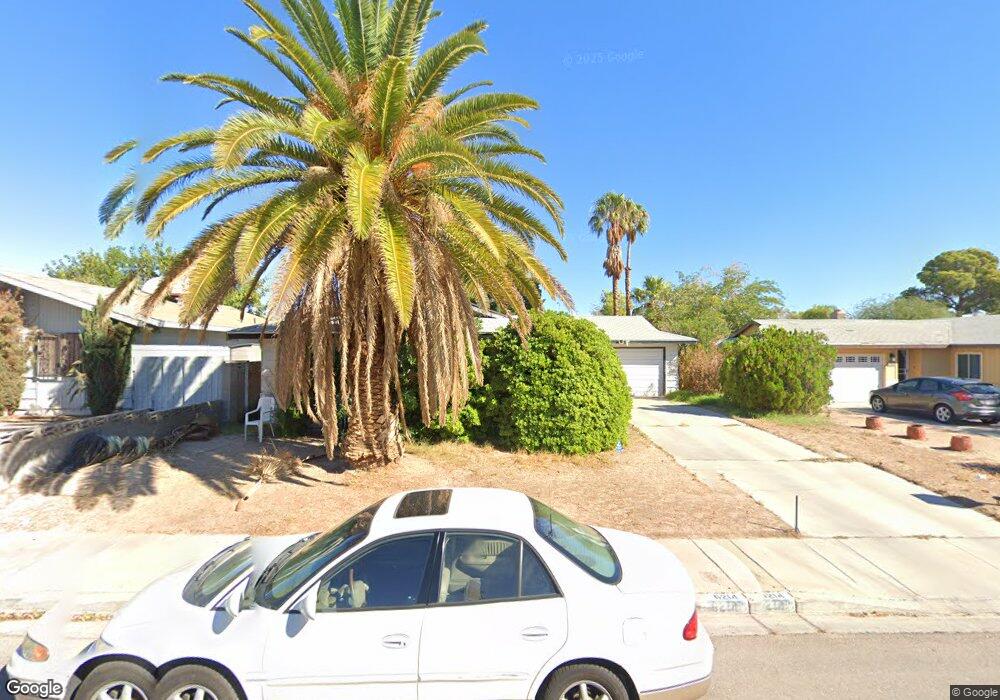
6214 Craigmont Ave Las Vegas, NV 89103
Estimated Value: $366,151 - $386,000
3
Beds
2
Baths
1,332
Sq Ft
$282/Sq Ft
Est. Value
About This Home
This home is located at 6214 Craigmont Ave, Las Vegas, NV 89103 and is currently estimated at $375,788, approximately $282 per square foot. 6214 Craigmont Ave is a home located in Clark County with nearby schools including Harvey N Dondero Elementary School, Kenny C Guinn Middle School, and Durango High School.
Ownership History
Date
Name
Owned For
Owner Type
Purchase Details
Closed on
Jul 29, 2005
Sold by
Dey Kathy N
Bought by
Dey Richard and Dey Kathy N
Current Estimated Value
Home Financials for this Owner
Home Financials are based on the most recent Mortgage that was taken out on this home.
Original Mortgage
$145,000
Outstanding Balance
$80,235
Interest Rate
6.5%
Mortgage Type
New Conventional
Estimated Equity
$295,553
Purchase Details
Closed on
Sep 20, 1999
Sold by
Dey Richard E
Bought by
Dey Kathy N and Freitas Agnes H
Purchase Details
Closed on
May 19, 1997
Sold by
Nugent Arthur and Nugent Eileen O
Bought by
Dey Richard E and Dey Kathy N
Home Financials for this Owner
Home Financials are based on the most recent Mortgage that was taken out on this home.
Original Mortgage
$93,500
Interest Rate
8.13%
Purchase Details
Closed on
Feb 27, 1996
Sold by
Nugent Arthur and Nugent Eileen Olive
Bought by
Nugent Arthur and Nugent Eileen O
Create a Home Valuation Report for This Property
The Home Valuation Report is an in-depth analysis detailing your home's value as well as a comparison with similar homes in the area
Home Values in the Area
Average Home Value in this Area
Purchase History
| Date | Buyer | Sale Price | Title Company |
|---|---|---|---|
| Dey Richard | -- | Ticor Title Of Nevada Inc | |
| Dey Kathy N | -- | Ticor Title Of Nevada Inc | |
| Dey Kathy N | -- | National Title Company | |
| Dey Richard E | $110,000 | Old Republic Title Company | |
| Nugent Arthur | -- | -- |
Source: Public Records
Mortgage History
| Date | Status | Borrower | Loan Amount |
|---|---|---|---|
| Open | Dey Richard | $145,000 | |
| Closed | Dey Richard E | $93,500 | |
| Closed | Dey Richard E | $93,500 |
Source: Public Records
Tax History Compared to Growth
Tax History
| Year | Tax Paid | Tax Assessment Tax Assessment Total Assessment is a certain percentage of the fair market value that is determined by local assessors to be the total taxable value of land and additions on the property. | Land | Improvement |
|---|---|---|---|---|
| 2025 | $1,081 | $53,270 | $34,300 | $18,970 |
| 2024 | $862 | $53,270 | $34,300 | $18,970 |
| 2023 | $862 | $50,677 | $32,550 | $18,127 |
| 2022 | $837 | $45,511 | $28,350 | $17,161 |
| 2021 | $813 | $41,005 | $24,150 | $16,855 |
| 2020 | $786 | $41,029 | $23,800 | $17,229 |
| 2019 | $763 | $37,048 | $19,600 | $17,448 |
| 2018 | $741 | $35,309 | $18,200 | $17,109 |
| 2017 | $980 | $33,416 | $15,750 | $17,666 |
| 2016 | $627 | $29,832 | $11,200 | $18,632 |
| 2015 | $878 | $28,230 | $9,450 | $18,780 |
| 2014 | $607 | $26,889 | $8,750 | $18,139 |
Source: Public Records
Map
Nearby Homes
- 6280 W University Ave
- 6196 W University Ave
- 4445 Peterson Dr
- 4481 Ridgeville St
- 4400 S Jones Blvd Unit 3086
- 4400 S Jones Blvd Unit 1128
- 4400 S Jones Blvd Unit 3119
- 4400 S Jones Blvd Unit 2061
- 4400 S Jones Blvd Unit 1119
- 4400 S Jones Blvd Unit 1140
- 4400 S Jones Blvd Unit 2102
- 4400 S Jones Blvd Unit 1057
- 4400 S Jones Blvd Unit 2087
- 4400 S Jones Blvd Unit 1125
- 4400 S Jones Blvd Unit 2007
- 6467 Newville Ave
- 6429 Bugbee Ave
- 4596 Eureka St
- 4292 Butterfield Way
- 6250 W Flamingo Rd Unit 88
- 6206 Craigmont Ave
- 6222 Craigmont Ave
- 6215 Gunderson Blvd
- 6232 Craigmont Ave
- 6196 Craigmont Ave
- 6207 Gunderson Blvd
- 6223 Gunderson Blvd
- 6215 Craigmont Ave
- 6197 Gunderson Blvd
- 6233 Gunderson Blvd
- 6207 Craigmont Ave
- 6223 Craigmont Ave
- 6188 Craigmont Ave
- 6240 Craigmont Ave
- 6197 Craigmont Ave
- 6233 Craigmont Ave Unit 1
- 6189 Gunderson Blvd
- 6241 Gunderson Blvd
- 6189 Craigmont Ave
- 6178 Craigmont Ave