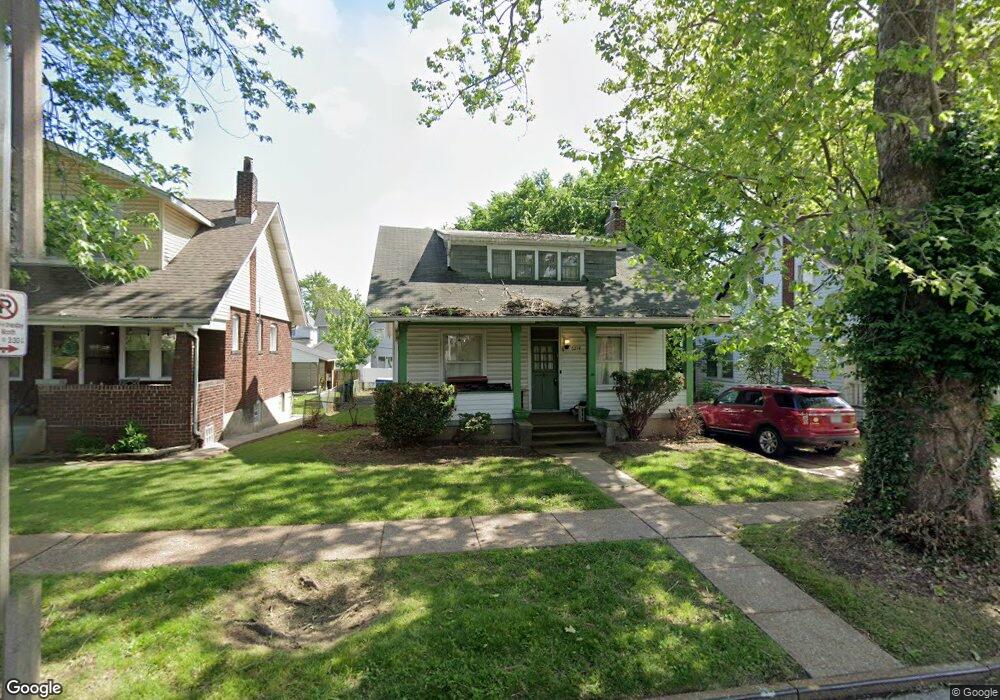
6214 Reber Place Saint Louis, MO 63139
Clifton Heights NeighborhoodEstimated Value: $204,277 - $273,000
--
Bed
2
Baths
1,960
Sq Ft
$125/Sq Ft
Est. Value
About This Home
This home is located at 6214 Reber Place, Saint Louis, MO 63139 and is currently estimated at $244,819, approximately $124 per square foot. 6214 Reber Place is a home located in St. Louis City with nearby schools including Mason Elementary School, Long International Middle School, and Roosevelt High School.
Ownership History
Date
Name
Owned For
Owner Type
Purchase Details
Closed on
Dec 8, 1997
Sold by
Emerick Blanche Bante and Emerick Donald L
Bought by
Phillips Gary Lee and Phillips Virginia
Current Estimated Value
Home Financials for this Owner
Home Financials are based on the most recent Mortgage that was taken out on this home.
Original Mortgage
$73,900
Outstanding Balance
$12,469
Interest Rate
7.2%
Mortgage Type
FHA
Estimated Equity
$232,350
Purchase Details
Closed on
Dec 4, 1997
Sold by
Knight Mary Martha and Knight Robert
Bought by
Phillips Gary Lee and Phillips Virginia
Home Financials for this Owner
Home Financials are based on the most recent Mortgage that was taken out on this home.
Original Mortgage
$73,900
Outstanding Balance
$12,469
Interest Rate
7.2%
Mortgage Type
FHA
Estimated Equity
$232,350
Purchase Details
Closed on
Dec 1, 1997
Sold by
Bante Arthur A and Bante Valaerie L
Bought by
Phillips Gary Lee and Phillips Virginia
Home Financials for this Owner
Home Financials are based on the most recent Mortgage that was taken out on this home.
Original Mortgage
$73,900
Outstanding Balance
$12,469
Interest Rate
7.2%
Mortgage Type
FHA
Estimated Equity
$232,350
Create a Home Valuation Report for This Property
The Home Valuation Report is an in-depth analysis detailing your home's value as well as a comparison with similar homes in the area
Home Values in the Area
Average Home Value in this Area
Purchase History
| Date | Buyer | Sale Price | Title Company |
|---|---|---|---|
| Phillips Gary Lee | -- | -- | |
| Phillips Gary Lee | -- | -- | |
| Phillips Gary Lee | -- | -- | |
| Phillips Gary Lee | -- | -- |
Source: Public Records
Mortgage History
| Date | Status | Borrower | Loan Amount |
|---|---|---|---|
| Open | Phillips Gary Lee | $73,900 |
Source: Public Records
Tax History Compared to Growth
Tax History
| Year | Tax Paid | Tax Assessment Tax Assessment Total Assessment is a certain percentage of the fair market value that is determined by local assessors to be the total taxable value of land and additions on the property. | Land | Improvement |
|---|---|---|---|---|
| 2025 | $2,294 | $32,240 | $3,570 | $28,670 |
| 2024 | $2,183 | $27,070 | $3,570 | $23,500 |
| 2023 | $2,183 | $27,070 | $3,570 | $23,500 |
| 2022 | $2,013 | $24,010 | $3,570 | $20,440 |
| 2021 | $2,010 | $24,010 | $3,570 | $20,440 |
| 2020 | $1,828 | $21,980 | $3,570 | $18,410 |
| 2019 | $1,822 | $21,980 | $3,570 | $18,410 |
| 2018 | $1,741 | $20,350 | $3,570 | $16,780 |
| 2017 | $1,712 | $20,350 | $3,570 | $16,780 |
| 2016 | $1,605 | $18,810 | $3,570 | $15,240 |
| 2015 | $1,456 | $18,810 | $3,570 | $15,240 |
| 2014 | $1,453 | $18,810 | $3,570 | $15,240 |
| 2013 | -- | $18,790 | $3,570 | $15,220 |
Source: Public Records
Map
Nearby Homes
- 2817 Knox Ct
- 6133 Magnolia Ave
- 6266 Marmaduke Ave
- 6140 Columbia Ave
- 6285 Magnolia Ave
- 6215 Columbia Ave
- 6020 Southwest Ave
- 6012 Odell St
- 2715 Watson Rd
- 6445 Odell St
- 6023 Arsenal St
- 5977 Arsenal St
- 5962 S Cuba Ct
- 6439 Arsenal St
- 6036 Arsenal St
- 6426 Arsenal St
- 6537 Marmaduke Ave
- 6547 Marmaduke Ave
- 5918 Southwest Ave
- 6541 Southwest Ave
- 6220 Reber Place
- 6208 Reber Place
- 6226 Reber Place
- 6206 Reber Place
- 6217 Marmaduke Ave
- 6215 Marmaduke Ave
- 6221 Marmaduke Ave
- 6200 Reber Place
- 6230 Reber Place
- 6225 Marmaduke Ave
- 6205 Marmaduke Ave
- 6215 Reber Place
- 6217 Reber Place
- 6211 Reber Place
- 6227 Marmaduke Ave
- 6221 Reber Place
- 6201 Marmaduke Ave
- 6235 Reber Place
- 6229 Marmaduke Ave