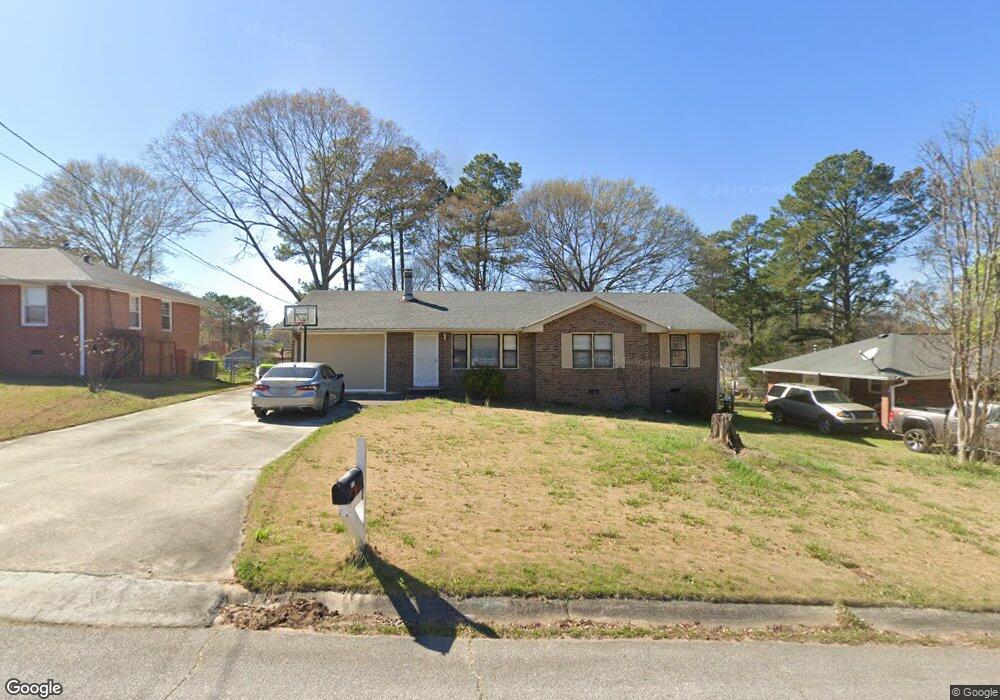
6215 Violet Ln Morrow, GA 30260
Estimated Value: $115,000 - $286,000
3
Beds
2
Baths
1,272
Sq Ft
$152/Sq Ft
Est. Value
About This Home
This home is located at 6215 Violet Ln, Morrow, GA 30260 and is currently estimated at $192,757, approximately $151 per square foot. 6215 Violet Ln is a home located in Clayton County with nearby schools including Thurgood Marshall Elementary School, Morrow Middle School, and Morrow High School.
Ownership History
Date
Name
Owned For
Owner Type
Purchase Details
Closed on
Dec 10, 2012
Sold by
Vu Quang Xuan
Bought by
Vu Quang Xuan and Vu Julie Ngoc
Current Estimated Value
Purchase Details
Closed on
Oct 4, 2011
Sold by
Bank Of America Na
Bought by
Vu Quang Xuan
Purchase Details
Closed on
May 3, 2011
Sold by
Gage Daniel R
Bought by
Bank Of America
Purchase Details
Closed on
Jul 2, 2007
Sold by
Caldwell Carolyn A
Bought by
Gage Daniel R
Home Financials for this Owner
Home Financials are based on the most recent Mortgage that was taken out on this home.
Original Mortgage
$122,050
Interest Rate
6.37%
Mortgage Type
New Conventional
Purchase Details
Closed on
Apr 17, 1998
Sold by
Christian Ronald S and Christian Helen J
Bought by
Caldwell Carolyn A
Home Financials for this Owner
Home Financials are based on the most recent Mortgage that was taken out on this home.
Original Mortgage
$61,500
Interest Rate
7.09%
Mortgage Type
New Conventional
Create a Home Valuation Report for This Property
The Home Valuation Report is an in-depth analysis detailing your home's value as well as a comparison with similar homes in the area
Home Values in the Area
Average Home Value in this Area
Purchase History
| Date | Buyer | Sale Price | Title Company |
|---|---|---|---|
| Vu Quang Xuan | -- | -- | |
| Vu Quang Xuan | $34,050 | -- | |
| Bank Of America | $33,300 | -- | |
| Gage Daniel R | $132,100 | -- | |
| Caldwell Carolyn A | $83,500 | -- |
Source: Public Records
Mortgage History
| Date | Status | Borrower | Loan Amount |
|---|---|---|---|
| Previous Owner | Gage Daniel R | $122,050 | |
| Previous Owner | Caldwell Carolyn A | $61,500 |
Source: Public Records
Tax History
| Year | Tax Paid | Tax Assessment Tax Assessment Total Assessment is a certain percentage of the fair market value that is determined by local assessors to be the total taxable value of land and additions on the property. | Land | Improvement |
|---|---|---|---|---|
| 2025 | $2,177 | $43,360 | $7,200 | $36,160 |
| 2024 | $2,448 | $72,760 | $7,200 | $65,560 |
| 2023 | $2,458 | $68,080 | $7,200 | $60,880 |
| 2022 | $1,565 | $49,880 | $7,200 | $42,680 |
| 2021 | $1,242 | $41,440 | $7,200 | $34,240 |
| 2020 | $1,071 | $36,786 | $7,200 | $29,586 |
| 2019 | $1,109 | $37,310 | $6,400 | $30,910 |
| 2018 | $992 | $34,433 | $6,400 | $28,033 |
| 2017 | $800 | $29,654 | $6,400 | $23,254 |
| 2016 | $651 | $26,002 | $6,400 | $19,602 |
| 2015 | $786 | $0 | $0 | $0 |
| 2014 | $617 | $25,494 | $6,400 | $19,094 |
Source: Public Records
Map
Nearby Homes
- 6227 Mount Zion Blvd
- 2280 Santa fe St Unit 17
- 2306 Santa fe St Unit 9
- 6200 Fieldcrest Dr Unit 3
- 6205 Fieldcrest Dr
- 2717 Shelley Ln
- 2509 Bonita Ct
- 6068 Mount Zion Blvd
- 2815 Teal Landing Dr
- 6082 Kathie Ct
- 2756 Kathie Ln
- 6380 Mount Zion Blvd
- 2731 Lynn Ct
- 2455 Lake Harbin Rd
- 2567 Creston Way
- 6203 Castlewood Dr
- 2497 Celina Ct
- 6397 E Meyer Dr
- 5986 Mount Zion Blvd
- 6266 Culver Dr
- 6225 Violet Ln
- 6209 Violet Ln
- 6206 Monica Dr
- 6233 Violet Ln
- 6216 Monica Dr Unit III
- 6199 Violet Ln
- 6200 Monica Dr
- 6214 Violet Ln Unit 3
- 6222 Monica Dr
- 6224 Violet Ln Unit III
- 6210 Violet Ln
- 6241 Violet Ln
- 2603 Lilac Dr
- 6234 Violet Ln
- 6202 Violet Ln
- 6230 Monica Dr
- 2615 Lilac Dr
- 2593 Lilac Dr
- 6240 Violet Ln
- 6249 Violet Ln
Your Personal Tour Guide
Ask me questions while you tour the home.