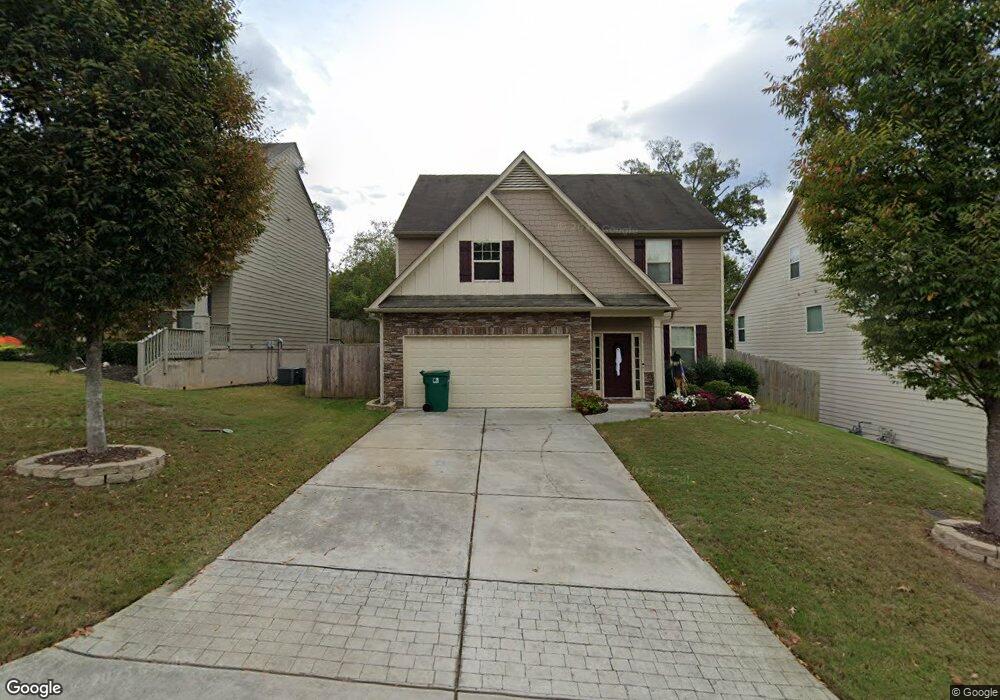
6216 Oakdale Ridge Ct SE Mableton, GA 30126
Estimated Value: $408,000 - $517,000
4
Beds
4
Baths
2,908
Sq Ft
$160/Sq Ft
Est. Value
About This Home
This home is located at 6216 Oakdale Ridge Ct SE, Mableton, GA 30126 and is currently estimated at $463,970, approximately $159 per square foot. 6216 Oakdale Ridge Ct SE is a home located in Cobb County with nearby schools including Clay-Harmony Leland Elementary School, Lindley Middle School, and Pebblebrook High School.
Ownership History
Date
Name
Owned For
Owner Type
Purchase Details
Closed on
Sep 10, 2020
Sold by
Garner Ernest and Garner Ashley
Bought by
Smith Kenneth M and Smith Keisha T
Current Estimated Value
Home Financials for this Owner
Home Financials are based on the most recent Mortgage that was taken out on this home.
Original Mortgage
$304,000
Outstanding Balance
$269,780
Interest Rate
2.9%
Mortgage Type
New Conventional
Estimated Equity
$194,190
Purchase Details
Closed on
May 30, 2013
Sold by
Mason James
Bought by
Green Ashley and Garner Ernest
Home Financials for this Owner
Home Financials are based on the most recent Mortgage that was taken out on this home.
Original Mortgage
$198,163
Interest Rate
3.25%
Mortgage Type
FHA
Purchase Details
Closed on
Sep 8, 2011
Sold by
Piedmont Residential Llc
Bought by
Mason James
Home Financials for this Owner
Home Financials are based on the most recent Mortgage that was taken out on this home.
Original Mortgage
$132,310
Interest Rate
4.38%
Mortgage Type
FHA
Create a Home Valuation Report for This Property
The Home Valuation Report is an in-depth analysis detailing your home's value as well as a comparison with similar homes in the area
Home Values in the Area
Average Home Value in this Area
Purchase History
| Date | Buyer | Sale Price | Title Company |
|---|---|---|---|
| Smith Kenneth M | $320,000 | None Available | |
| Green Ashley | $207,000 | -- | |
| Mason James | $196,000 | -- |
Source: Public Records
Mortgage History
| Date | Status | Borrower | Loan Amount |
|---|---|---|---|
| Open | Smith Kenneth M | $304,000 | |
| Previous Owner | Green Ashley | $198,163 | |
| Previous Owner | Green Ashley | $5,000 | |
| Previous Owner | Mason James | $132,310 |
Source: Public Records
Tax History Compared to Growth
Tax History
| Year | Tax Paid | Tax Assessment Tax Assessment Total Assessment is a certain percentage of the fair market value that is determined by local assessors to be the total taxable value of land and additions on the property. | Land | Improvement |
|---|---|---|---|---|
| 2024 | $3,723 | $160,680 | $40,000 | $120,680 |
| 2023 | $3,234 | $160,680 | $40,000 | $120,680 |
| 2022 | $3,532 | $148,984 | $20,000 | $128,984 |
| 2021 | $3,131 | $126,912 | $18,000 | $108,912 |
| 2020 | $2,615 | $116,952 | $18,000 | $98,952 |
| 2019 | $2,615 | $116,952 | $18,000 | $98,952 |
| 2018 | $2,424 | $106,916 | $18,000 | $88,916 |
| 2017 | $2,308 | $106,916 | $18,000 | $88,916 |
| 2016 | $2,129 | $97,376 | $20,000 | $77,376 |
| 2015 | $1,955 | $85,964 | $20,000 | $65,964 |
| 2014 | $1,827 | $78,400 | $0 | $0 |
Source: Public Records
Map
Nearby Homes
- 1565 Oakdale Bluffs Dr SE
- 1444 Ridgebend Way SE
- 6038 Mayfield Way SE
- 6213 Indian Wood Cir SE
- 6255 Oakdale Rd SE
- 6207 Indian Wood Cir SE
- 6304 Brookwater View SE
- 6148 Indian Wood Cir SE
- 1629 Watercress Ct SE
- 6157 Indian Wood Cir SE
- 6112 Holly Park Ln SE
- 1470 Riverline Ct SE
- 6018 Oakdale Rd SE
- 6254 Village Arbor Ln
- 6294 Century Park Place SE
- 1507 Justine Way SE
- 6216 Oakdale Ridge Ct SE Unit 23
- 6218 Oakdale Ridge Ct SE Unit 24
- 6218 Oakdale Ridge Ct SE
- 6214 Oakdale Ridge Ct SE
- 6220 Oakdale Ridge Ct SE
- 6212 Oakdale Ridge Ct SE
- 6219 Oakdale Ridge Ct SE
- 6217 Oakdale Ridge Ct SE
- 6215 Oakdale Ridge Ct SE Unit 7
- 6215 Oakdale Ridge Ct SE
- 6210 Oakdale Ridge Ct SE
- 6210 Oakdale Ridge Ct SE
- 6213 Oakdale Ridge Ct SE
- 6213 Oakdale Ridge Ct SE Unit 8
- 6221 Oakdale Ridge Ct SE
- 6221 Oakdale Ridge Ct SE Unit 4
- 6211 Oakdale Ridge Ct SE
- 6208 Oakdale Ridge Ct SE
- 6223 Oakdale Ridge Ct SE
- 6223 Oakdale Ridge Ct SE Unit 3