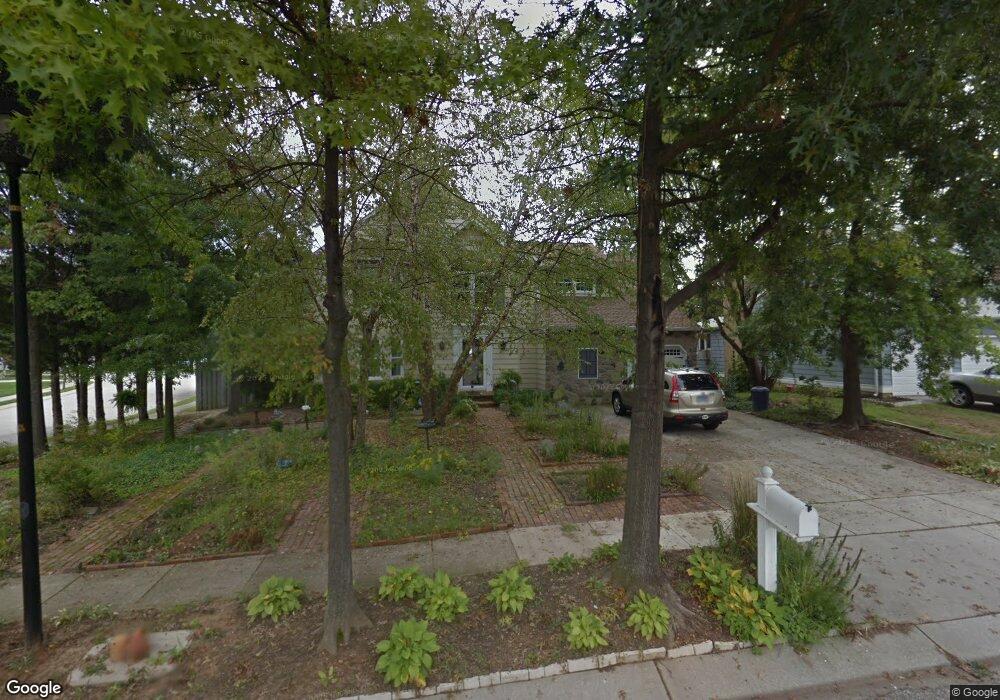
6217 Chestnut Oak Ln Linthicum Heights, MD 21090
Estimated Value: $553,000 - $633,000
--
Bed
3
Baths
2,220
Sq Ft
$268/Sq Ft
Est. Value
About This Home
This home is located at 6217 Chestnut Oak Ln, Linthicum Heights, MD 21090 and is currently estimated at $594,626, approximately $267 per square foot. 6217 Chestnut Oak Ln is a home located in Anne Arundel County with nearby schools including Lindale Middle School, North County High School, and St. Philip Neri Elementary School.
Ownership History
Date
Name
Owned For
Owner Type
Purchase Details
Closed on
Sep 23, 2024
Sold by
Cossentino Christian F and Cossentino Rebecca D
Bought by
Cossentino Christian F and Cossentino Rebecca D
Current Estimated Value
Purchase Details
Closed on
Dec 25, 2016
Sold by
Cossentino Joyce A
Bought by
Cossentino Joyce A and Cossentino Christian F
Home Financials for this Owner
Home Financials are based on the most recent Mortgage that was taken out on this home.
Original Mortgage
$309,662
Interest Rate
4.03%
Mortgage Type
New Conventional
Purchase Details
Closed on
Feb 7, 1989
Bought by
Cossentino Raphael T and Cossentino Joyce A
Home Financials for this Owner
Home Financials are based on the most recent Mortgage that was taken out on this home.
Original Mortgage
$60,000
Interest Rate
10.55%
Create a Home Valuation Report for This Property
The Home Valuation Report is an in-depth analysis detailing your home's value as well as a comparison with similar homes in the area
Home Values in the Area
Average Home Value in this Area
Purchase History
| Date | Buyer | Sale Price | Title Company |
|---|---|---|---|
| Cossentino Christian F | -- | None Listed On Document | |
| Cossentino Christian F | -- | None Listed On Document | |
| Cossentino Joyce A | -- | Tower Title Service | |
| Cossentino Raphael T | $188,600 | -- |
Source: Public Records
Mortgage History
| Date | Status | Borrower | Loan Amount |
|---|---|---|---|
| Previous Owner | Cossentino Joyce A | $309,662 | |
| Previous Owner | Cossentino Raphael T | $60,000 |
Source: Public Records
Tax History Compared to Growth
Tax History
| Year | Tax Paid | Tax Assessment Tax Assessment Total Assessment is a certain percentage of the fair market value that is determined by local assessors to be the total taxable value of land and additions on the property. | Land | Improvement |
|---|---|---|---|---|
| 2025 | $3,675 | $479,700 | $177,700 | $302,000 |
| 2024 | $3,675 | $451,867 | $0 | $0 |
| 2023 | $3,554 | $424,033 | $0 | $0 |
| 2022 | $3,306 | $396,200 | $157,700 | $238,500 |
| 2021 | $6,498 | $387,833 | $0 | $0 |
| 2020 | $3,153 | $379,467 | $0 | $0 |
| 2019 | $3,100 | $371,100 | $140,900 | $230,200 |
| 2018 | $3,763 | $371,100 | $140,900 | $230,200 |
| 2017 | $2,940 | $371,100 | $0 | $0 |
| 2016 | -- | $397,300 | $0 | $0 |
| 2015 | -- | $390,167 | $0 | $0 |
| 2014 | -- | $383,033 | $0 | $0 |
Source: Public Records
Map
Nearby Homes
- 300 Twin Oaks Rd
- 437 Kingwood Rd
- 306 John Ave
- 112 S Camp Meade Rd
- 102 Catalpa Rd
- 0 Laurel Rd
- 304 S Camp Meade Rd
- 107 Michael Ave
- 306 S Camp Meade Rd
- 504 Cleveland Rd
- 401 Forest View Rd
- 331 E Maple Rd
- 536 Forest View Rd
- 6222 Woodland Rd
- 701 E Maple Rd
- 302 Regency Cir
- 902 Wanda Rd
- 6246 Woodland Rd
- 6 Mountain Rd
- 5722 Howard Dr
- 6215 Chestnut Oak Ln
- 6200 Emory Oak Ct
- 6202 Emory Oak Ct
- 6204 Emory Oak Ct
- 6213 Chestnut Oak Ln
- 6216 Chestnut Oak Ln
- 6218 Chestnut Oak Ln
- 6214 Chestnut Oak Ln
- 6220 Chestnut Oak Ln
- 6211 Chestnut Oak Ln
- 6223 Chestnut Oak Ln
- 6212 Chestnut Oak Ln
- 6201 Emory Oak Ct
- 202 Old English Oak Ct
- 6220 Medora Rd
- 6222 Chestnut Oak Ln
- 6207 Chestnut Oak Ln
- 6218 Medora Rd
- 6222 Medora Rd
- 119 N Hammonds Ferry Rd