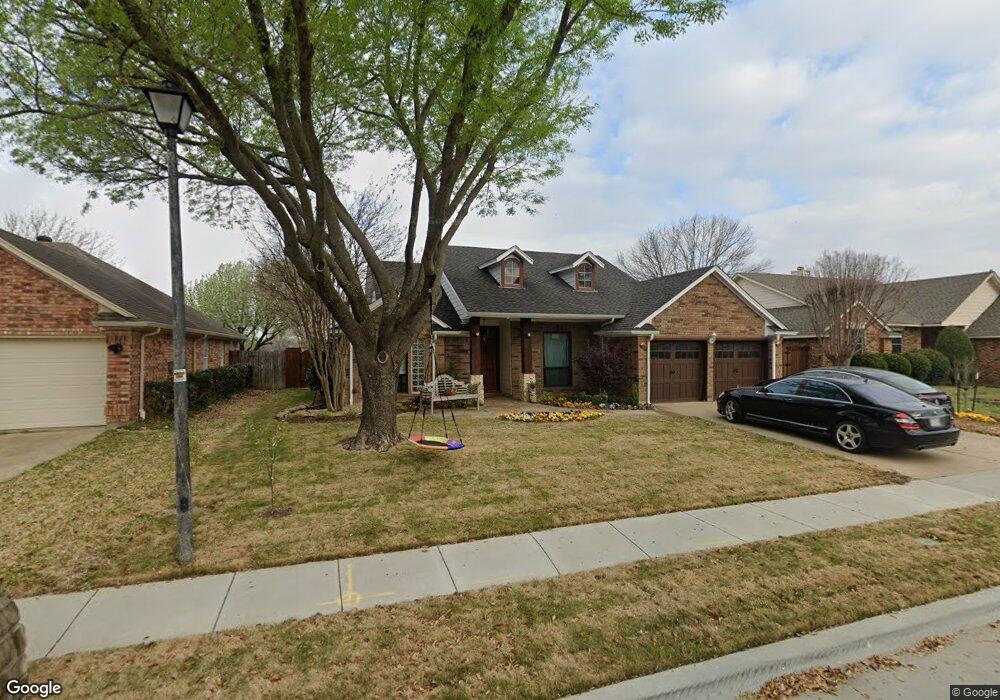
6217 Covington Dr Rowlett, TX 75089
Springfield NeighborhoodEstimated Value: $359,183 - $370,000
4
Beds
2
Baths
1,883
Sq Ft
$193/Sq Ft
Est. Value
About This Home
This home is located at 6217 Covington Dr, Rowlett, TX 75089 and is currently estimated at $363,546, approximately $193 per square foot. 6217 Covington Dr is a home located in Dallas County with nearby schools including Harmony Science Academy - Garland, Harmony School of Innovation - Garland, and Wesleyan Christian Academy.
Ownership History
Date
Name
Owned For
Owner Type
Purchase Details
Closed on
Nov 12, 2021
Sold by
Walden Carin I
Bought by
Barrett Nicholas and Barrett Karen
Current Estimated Value
Purchase Details
Closed on
May 18, 1998
Sold by
Harrison Charles E and Harrison Billie J
Bought by
Walden Carin I
Home Financials for this Owner
Home Financials are based on the most recent Mortgage that was taken out on this home.
Original Mortgage
$106,138
Interest Rate
7.27%
Purchase Details
Closed on
May 24, 1996
Sold by
Senitz Lowell J and Senitz Sally C
Bought by
Harrison Charles E and Harrison Billie J
Home Financials for this Owner
Home Financials are based on the most recent Mortgage that was taken out on this home.
Original Mortgage
$93,420
Interest Rate
7.93%
Mortgage Type
Seller Take Back
Create a Home Valuation Report for This Property
The Home Valuation Report is an in-depth analysis detailing your home's value as well as a comparison with similar homes in the area
Home Values in the Area
Average Home Value in this Area
Purchase History
| Date | Buyer | Sale Price | Title Company |
|---|---|---|---|
| Barrett Nicholas | -- | Mbl Title | |
| Walden Carin I | -- | -- | |
| Harrison Charles E | -- | -- |
Source: Public Records
Mortgage History
| Date | Status | Borrower | Loan Amount |
|---|---|---|---|
| Previous Owner | Walden Carin I | $106,138 | |
| Previous Owner | Harrison Charles E | $93,420 |
Source: Public Records
Tax History
| Year | Tax Paid | Tax Assessment Tax Assessment Total Assessment is a certain percentage of the fair market value that is determined by local assessors to be the total taxable value of land and additions on the property. | Land | Improvement |
|---|---|---|---|---|
| 2025 | $6,098 | $383,360 | $80,000 | $303,360 |
| 2024 | $6,098 | $383,360 | $80,000 | $303,360 |
| 2023 | $6,098 | $406,200 | $80,000 | $326,200 |
| 2022 | $5,835 | $308,000 | $80,000 | $228,000 |
| 2021 | $6,333 | $241,940 | $48,000 | $193,940 |
| 2020 | $6,390 | $241,940 | $48,000 | $193,940 |
| 2019 | $6,351 | $221,000 | $40,000 | $181,000 |
| 2018 | $6,396 | $221,000 | $40,000 | $181,000 |
| 2017 | $5,751 | $198,180 | $40,000 | $158,180 |
| 2016 | $5,052 | $174,100 | $30,000 | $144,100 |
| 2015 | $3,111 | $142,600 | $30,000 | $112,600 |
| 2014 | $3,111 | $129,830 | $30,000 | $99,830 |
Source: Public Records
Map
Nearby Homes
- 1513 Columbus Dr
- 6409 Wildhaven Dr
- 5810 Kittyhawk Dr
- 6317 Teresa Ln
- 6307 Teresa Ln
- 6518 Wildhaven Dr
- 6529 Bandalia Dr
- 6518 Day Farm Ct
- 5702 Antioch Dr
- 6613 Springmeadow Ln
- 6921 Hominy Ridge
- 6306 Debbie Cir
- 7005 Buckhorn Dr
- 6710 Falcon St
- 6317 Locust St
- 6017 Mimosa Ln
- 6004 Mimosa Ln
- 718 Castlewood Dr
- 7606 Glenstone St
- 1509 Biltmore Dr
- 6213 Covington Dr
- 6301 Covington Dr
- 6209 Covington Dr
- 6305 Covington Dr
- 6218 Kittyhawk Dr
- 6205 Covington Dr
- 6209 Kittyhawk Dr
- 6214 Kittyhawk Dr
- 6201 Covington Dr
- 6205 Kittyhawk Dr
- 6202 Covington Dr
- 6210 Kittyhawk Dr
- 6117 Covington Dr
- 6201 Kittyhawk Dr
- 6118 Covington Dr
- 6113 Covington Dr
- 6206 Kittyhawk Dr
- 6117 Kittyhawk Dr
- 6114 Covington Dr
- 6113 Kittyhawk Dr
Your Personal Tour Guide
Ask me questions while you tour the home.