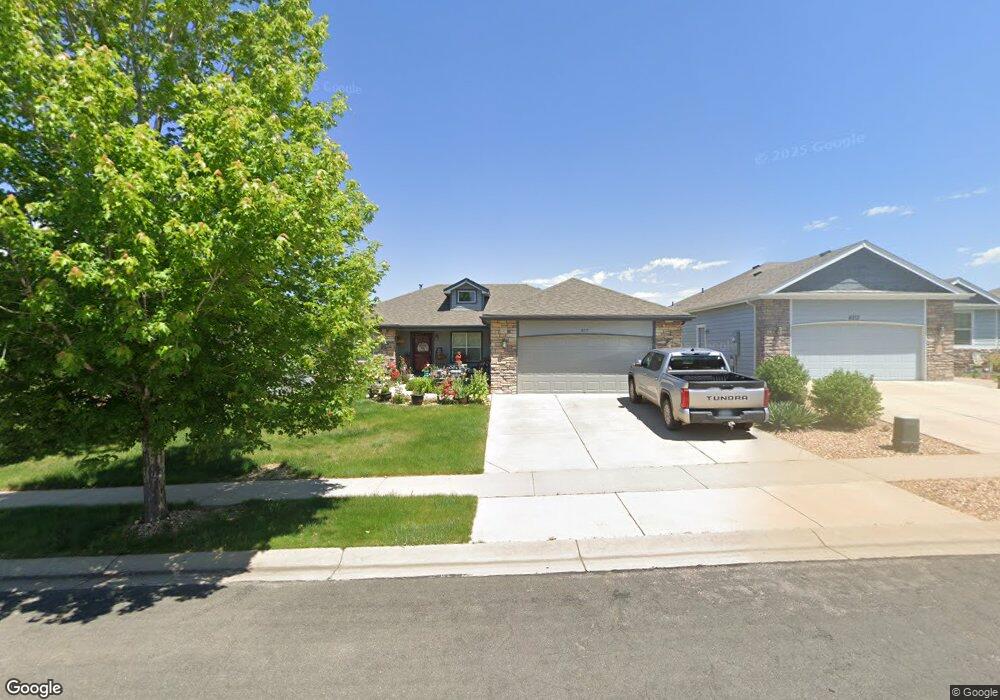
6217 W 13th Street Rd Greeley, CO 80634
Estimated Value: $457,887 - $501,000
3
Beds
2
Baths
3,208
Sq Ft
$152/Sq Ft
Est. Value
About This Home
This home is located at 6217 W 13th Street Rd, Greeley, CO 80634 and is currently estimated at $487,972, approximately $152 per square foot. 6217 W 13th Street Rd is a home located in Weld County with nearby schools including Greeley Central High School, University Schools, and West Ridge Academy Charter.
Ownership History
Date
Name
Owned For
Owner Type
Purchase Details
Closed on
May 20, 2015
Sold by
Clrm Enterprises Llc
Bought by
Richmond Misty
Current Estimated Value
Home Financials for this Owner
Home Financials are based on the most recent Mortgage that was taken out on this home.
Original Mortgage
$245,470
Outstanding Balance
$189,307
Interest Rate
3.71%
Mortgage Type
FHA
Estimated Equity
$298,665
Purchase Details
Closed on
Mar 7, 2011
Sold by
Masters Timothy L
Bought by
Clrm Enterprises Llc
Purchase Details
Closed on
Aug 31, 2010
Sold by
Suncrest Investment Property Services Ll
Bought by
Master Timothy L
Purchase Details
Closed on
Nov 10, 2009
Sold by
National Bank Of Kansas City
Bought by
Suncrest Investment Property Services Ll
Purchase Details
Closed on
Aug 17, 2009
Sold by
Horner Joshua A
Bought by
National Bank Of Kansas City
Create a Home Valuation Report for This Property
The Home Valuation Report is an in-depth analysis detailing your home's value as well as a comparison with similar homes in the area
Home Values in the Area
Average Home Value in this Area
Purchase History
| Date | Buyer | Sale Price | Title Company |
|---|---|---|---|
| Richmond Misty | $250,000 | Chicago Title Co | |
| Clrm Enterprises Llc | -- | None Available | |
| Master Timothy L | $168,500 | Heritage Title | |
| Suncrest Investment Property Services Ll | -- | None Available | |
| National Bank Of Kansas City | -- | None Available |
Source: Public Records
Mortgage History
| Date | Status | Borrower | Loan Amount |
|---|---|---|---|
| Open | Richmond Misty | $245,470 |
Source: Public Records
Tax History Compared to Growth
Tax History
| Year | Tax Paid | Tax Assessment Tax Assessment Total Assessment is a certain percentage of the fair market value that is determined by local assessors to be the total taxable value of land and additions on the property. | Land | Improvement |
|---|---|---|---|---|
| 2025 | $2,177 | $28,620 | $5,000 | $23,620 |
| 2024 | $2,177 | $28,620 | $5,000 | $23,620 |
| 2023 | $2,077 | $29,520 | $5,410 | $24,110 |
| 2022 | $2,159 | $24,640 | $4,870 | $19,770 |
| 2021 | $2,227 | $25,350 | $5,010 | $20,340 |
| 2020 | $2,067 | $23,600 | $4,290 | $19,310 |
| 2019 | $2,072 | $23,600 | $4,290 | $19,310 |
| 2018 | $1,687 | $20,270 | $2,810 | $17,460 |
| 2017 | $1,696 | $20,270 | $2,810 | $17,460 |
| 2016 | $1,407 | $18,910 | $2,390 | $16,520 |
| 2015 | $1,402 | $18,910 | $2,390 | $16,520 |
| 2014 | -- | $15,410 | $2,230 | $13,180 |
Source: Public Records
Map
Nearby Homes
- 1505 63rd Avenue Ct
- 6405 W 16th St
- 6122 W 8th St
- 624 61st Ave
- 1637 58th Ave
- 5627 W 16th Street Rd
- 718 66th Ave
- 729 67th Ave
- 1719 58th Avenue Ct
- 608 63rd Ave
- 5312 W 11th St
- 702 66th Ave
- 1705 67th Ave
- 5602 W 16th Street Rd
- 5809 W 18th St
- 1618 69th Ave
- 6622 W 6th St
- 1470 71st Ave
- 6637 W 6th St
- 5601 18th St Unit 30
- 6221 W 13th Street Rd
- 6221 W 13th Street Rd
- 6213 W 13th Street Rd
- 6209 W 13th Street Rd
- 6225 W 13th Street Rd
- 6218 W 13th Street Rd
- 6214 W 13th Street Rd
- 6222 W 13th Street Rd
- 6222 W 13th Street Rd
- 6229 W 13th Street Rd
- 6205 W 13th Street Rd
- 6210 W 13th Street Rd
- 1304 63rd Ave
- 6303 W 13th Street Rd
- 1308 63rd Ave
- 6201 W 13th Street Rd
- 6201 W 13th Street Rd
- 6223 W 14th Street Rd
- 6215 W 14th Street Rd
- 6307 W 13th Street Rd