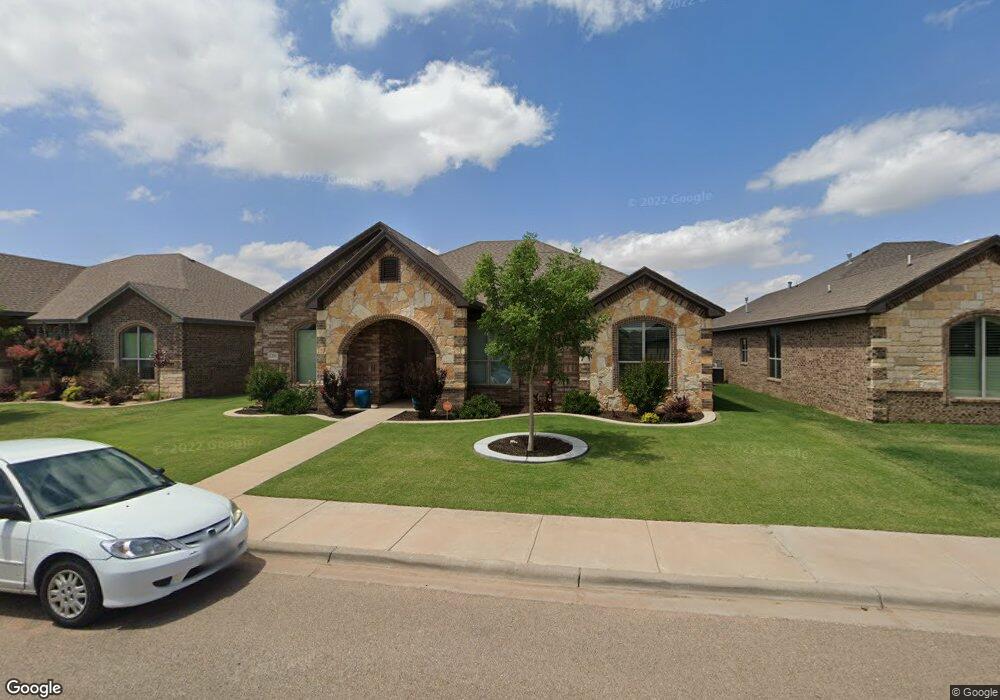
6218 93rd St Lubbock, TX 79424
Estimated Value: $316,036 - $329,000
4
Beds
2
Baths
2,032
Sq Ft
$159/Sq Ft
Est. Value
About This Home
This home is located at 6218 93rd St, Lubbock, TX 79424 and is currently estimated at $324,009, approximately $159 per square foot. 6218 93rd St is a home with nearby schools including Crestview Elementary School, Heritage Middle School, and Frenship High School.
Ownership History
Date
Name
Owned For
Owner Type
Purchase Details
Closed on
Jun 25, 2014
Sold by
Roten Homes Inc
Bought by
Beevers Joshua and Beevers Christy
Current Estimated Value
Home Financials for this Owner
Home Financials are based on the most recent Mortgage that was taken out on this home.
Original Mortgage
$212,599
Outstanding Balance
$158,926
Interest Rate
3.75%
Mortgage Type
FHA
Estimated Equity
$165,083
Purchase Details
Closed on
Feb 18, 2014
Sold by
Day Estates Ltd
Bought by
Beevers Joshua and Beevers Christy
Create a Home Valuation Report for This Property
The Home Valuation Report is an in-depth analysis detailing your home's value as well as a comparison with similar homes in the area
Home Values in the Area
Average Home Value in this Area
Purchase History
| Date | Buyer | Sale Price | Title Company |
|---|---|---|---|
| Beevers Joshua | -- | Service Title | |
| Beevers Joshua | -- | -- |
Source: Public Records
Mortgage History
| Date | Status | Borrower | Loan Amount |
|---|---|---|---|
| Open | Beevers Joshua | $212,599 |
Source: Public Records
Tax History Compared to Growth
Tax History
| Year | Tax Paid | Tax Assessment Tax Assessment Total Assessment is a certain percentage of the fair market value that is determined by local assessors to be the total taxable value of land and additions on the property. | Land | Improvement |
|---|---|---|---|---|
| 2025 | $5,228 | $306,283 | $31,568 | $274,715 |
| 2024 | $5,228 | $309,302 | $31,568 | $277,734 |
| 2023 | $5,218 | $304,511 | $31,568 | $278,748 |
| 2022 | $6,303 | $276,828 | $31,568 | $245,260 |
| 2021 | $6,148 | $254,232 | $31,568 | $222,664 |
| 2020 | $6,015 | $247,575 | $31,568 | $216,007 |
| 2019 | $5,927 | $237,094 | $31,568 | $205,526 |
| 2018 | $5,757 | $230,024 | $31,568 | $198,456 |
| 2017 | $5,815 | $232,050 | $31,568 | $200,482 |
| 2016 | $5,865 | $234,075 | $31,568 | $202,507 |
| 2015 | $651 | $224,894 | $25,956 | $198,938 |
| 2014 | $651 | $25,956 | $25,956 | $0 |
Source: Public Records
Map
Nearby Homes