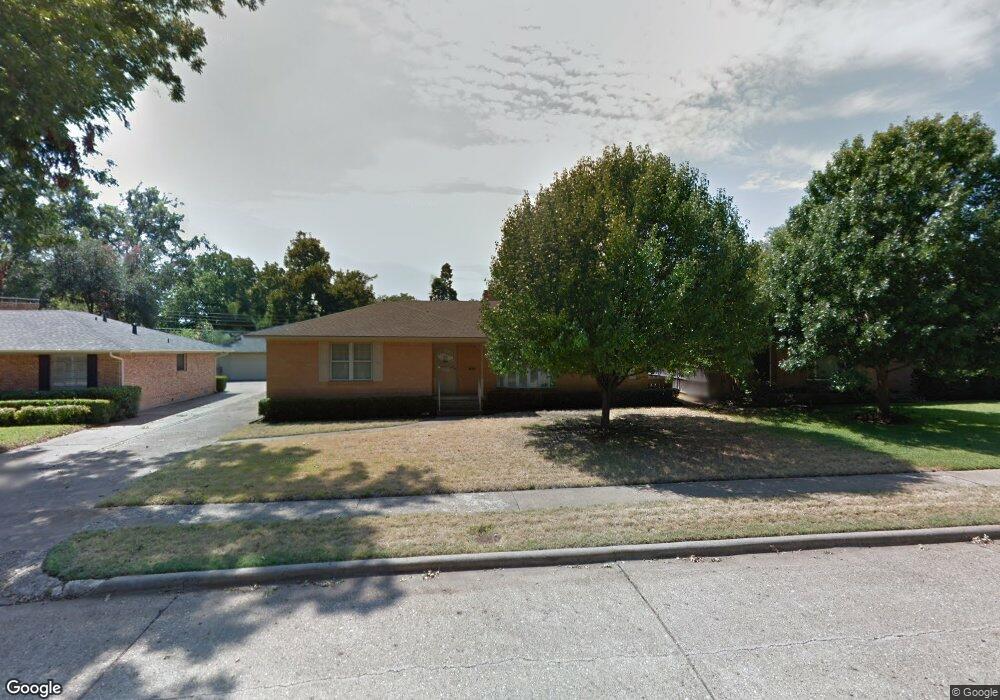
6218 Crestmont Dr Dallas, TX 75214
Northeast Dallas NeighborhoodEstimated Value: $795,000 - $908,000
4
Beds
4
Baths
2,615
Sq Ft
$324/Sq Ft
Est. Value
About This Home
This home is located at 6218 Crestmont Dr, Dallas, TX 75214 and is currently estimated at $846,656, approximately $323 per square foot. 6218 Crestmont Dr is a home located in Dallas County with nearby schools including Dan D Rogers Elementary School, Benjamin Franklin International Exploratory Academy, and Hillcrest High School.
Ownership History
Date
Name
Owned For
Owner Type
Purchase Details
Closed on
Apr 22, 2020
Sold by
Himelfard Matthew M and Himelfard Meredith S
Bought by
Hall Matthew M and Bertiery Erika Lopez
Current Estimated Value
Home Financials for this Owner
Home Financials are based on the most recent Mortgage that was taken out on this home.
Original Mortgage
$370,000
Outstanding Balance
$327,153
Interest Rate
3.3%
Mortgage Type
New Conventional
Estimated Equity
$519,503
Purchase Details
Closed on
Feb 18, 2015
Sold by
Jl Highgate Homes Llc Series E
Bought by
Himelfarb Matthew M and Himelfarb Meredith S
Home Financials for this Owner
Home Financials are based on the most recent Mortgage that was taken out on this home.
Original Mortgage
$399,200
Interest Rate
3.78%
Mortgage Type
New Conventional
Purchase Details
Closed on
Aug 8, 2014
Sold by
Shipp Irene Ragon
Bought by
Jl Highgate Homes Llc Series E
Purchase Details
Closed on
Jan 12, 1999
Sold by
Ship William Hayden and Shipp William H
Bought by
Shipp William Hayden and Shipp Irene Ragon
Create a Home Valuation Report for This Property
The Home Valuation Report is an in-depth analysis detailing your home's value as well as a comparison with similar homes in the area
Home Values in the Area
Average Home Value in this Area
Purchase History
| Date | Buyer | Sale Price | Title Company |
|---|---|---|---|
| Hall Matthew M | -- | None Available | |
| Himelfarb Matthew M | -- | Capital Title | |
| Jl Highgate Homes Llc Series E | -- | Rtt | |
| Shipp William Hayden | -- | -- |
Source: Public Records
Mortgage History
| Date | Status | Borrower | Loan Amount |
|---|---|---|---|
| Open | Hall Matthew M | $370,000 | |
| Previous Owner | Himelfarb Matthew M | $399,200 | |
| Closed | Jl Highgate Homes Llc Series E | $0 |
Source: Public Records
Tax History Compared to Growth
Tax History
| Year | Tax Paid | Tax Assessment Tax Assessment Total Assessment is a certain percentage of the fair market value that is determined by local assessors to be the total taxable value of land and additions on the property. | Land | Improvement |
|---|---|---|---|---|
| 2025 | $13,229 | $871,790 | $518,350 | $353,440 |
| 2024 | $13,229 | $753,630 | $250,000 | $503,630 |
| 2023 | $13,229 | $745,750 | $250,000 | $495,750 |
| 2022 | $14,045 | $682,680 | $210,000 | $472,680 |
| 2021 | $14,532 | $664,080 | $185,000 | $479,080 |
| 2020 | $15,382 | $567,000 | $185,000 | $382,000 |
| 2019 | $16,132 | $567,000 | $185,000 | $382,000 |
| 2018 | $16,120 | $592,830 | $185,000 | $407,830 |
| 2017 | $14,083 | $517,910 | $175,000 | $342,910 |
| 2016 | $12,935 | $475,670 | $135,000 | $340,670 |
| 2015 | $2,417 | $409,410 | $95,000 | $314,410 |
| 2014 | $2,417 | $291,320 | $95,000 | $196,320 |
Source: Public Records
Map
Nearby Homes
- 6327 Town Hill Ln
- 6333 Town Hill Ln
- 6105 Rincon Way
- 6129 Glennox Ln
- 6350 Glennox Ln
- 6349 Highgate Ln
- 6151 Chesley Ln
- 5007 Creighton Dr
- 6121 Chesley Ln
- 5105 Skillman St Unit 120E
- 5111 Skillman St Unit 128
- 6431 Dunstan Ln
- 6222 E University Blvd
- 4927 Creighton Dr
- 6305 Annapolis Ln
- 5132 Amesbury Dr Unit 205A
- 5130 Amesbury Dr Unit 103
- 5130 Amesbury Dr Unit 203
- 5154 Amesbury Dr Unit 227F
- 6517 Highgate Ln
- 6210 Crestmont Dr
- 6222 Crestmont Dr
- 6228 Crestmont Dr
- 6206 Crestmont Dr
- 6217 Town Hill Ln
- 6221 Town Hill Ln
- 6211 Town Hill Ln
- 6227 Town Hill Ln
- 6211 Crestmont Dr
- 6221 Crestmont Dr
- 6232 Crestmont Dr
- 6207 Crestmont Dr
- 6205 Town Hill Ln
- 6233 Town Hill Ln
- 6227 Crestmont Dr
- 6157 Crestmont Dr
- 6239 Town Hill Ln
- 6233 Crestmont Dr
- 6238 Crestmont Dr
- 6148 Crestmont Dr