6219 Boulder Ridge NE Belmont, MI 49306
Estimated Value: $714,321 - $798,000
4
Beds
5
Baths
3,426
Sq Ft
$217/Sq Ft
Est. Value
About This Home
This home is located at 6219 Boulder Ridge NE, Belmont, MI 49306 and is currently estimated at $744,330, approximately $217 per square foot. 6219 Boulder Ridge NE is a home located in Kent County with nearby schools including Crestwood Elementary School, East Rockford Middle School, and Rockford High School.
Ownership History
Date
Name
Owned For
Owner Type
Purchase Details
Closed on
Jul 11, 2022
Sold by
Vanthiel Ronald E and Vanthiel Mary E
Bought by
Cimonian Aram
Current Estimated Value
Home Financials for this Owner
Home Financials are based on the most recent Mortgage that was taken out on this home.
Original Mortgage
$480,000
Outstanding Balance
$456,665
Interest Rate
5.09%
Mortgage Type
Balloon
Estimated Equity
$287,665
Purchase Details
Closed on
Nov 7, 2011
Sold by
Klinkner Daniel J and Klinkner Martha B
Bought by
Vanthiel Ronald E and Vanthiel Van Thiel
Home Financials for this Owner
Home Financials are based on the most recent Mortgage that was taken out on this home.
Original Mortgage
$268,200
Interest Rate
4.11%
Mortgage Type
New Conventional
Purchase Details
Closed on
Mar 16, 1999
Bought by
Caster David M and Van Thiel Ronald E
Purchase Details
Closed on
Jan 13, 1998
Create a Home Valuation Report for This Property
The Home Valuation Report is an in-depth analysis detailing your home's value as well as a comparison with similar homes in the area
Home Values in the Area
Average Home Value in this Area
Purchase History
| Date | Buyer | Sale Price | Title Company |
|---|---|---|---|
| Cimonian Aram | $600,000 | None Listed On Document | |
| Vanthiel Ronald E | $298,000 | First American Title Ins Co | |
| Caster David M | $110,000 | -- | |
| -- | $9,000 | -- |
Source: Public Records
Mortgage History
| Date | Status | Borrower | Loan Amount |
|---|---|---|---|
| Open | Cimonian Aram | $480,000 | |
| Previous Owner | Vanthiel Ronald E | $268,200 |
Source: Public Records
Tax History Compared to Growth
Tax History
| Year | Tax Paid | Tax Assessment Tax Assessment Total Assessment is a certain percentage of the fair market value that is determined by local assessors to be the total taxable value of land and additions on the property. | Land | Improvement |
|---|---|---|---|---|
| 2025 | $6,417 | $331,700 | $0 | $0 |
| 2024 | $6,417 | $312,900 | $0 | $0 |
| 2023 | $6,139 | $285,800 | $0 | $0 |
| 2022 | $6,604 | $243,600 | $0 | $0 |
| 2021 | $6,430 | $235,700 | $0 | $0 |
| 2020 | $4,150 | $227,400 | $0 | $0 |
| 2019 | $6,333 | $200,700 | $0 | $0 |
| 2018 | $6,333 | $206,900 | $0 | $0 |
| 2017 | $6,167 | $206,200 | $0 | $0 |
| 2016 | $5,962 | $190,500 | $0 | $0 |
| 2015 | $5,779 | $190,500 | $0 | $0 |
| 2013 | -- | $171,400 | $0 | $0 |
Source: Public Records
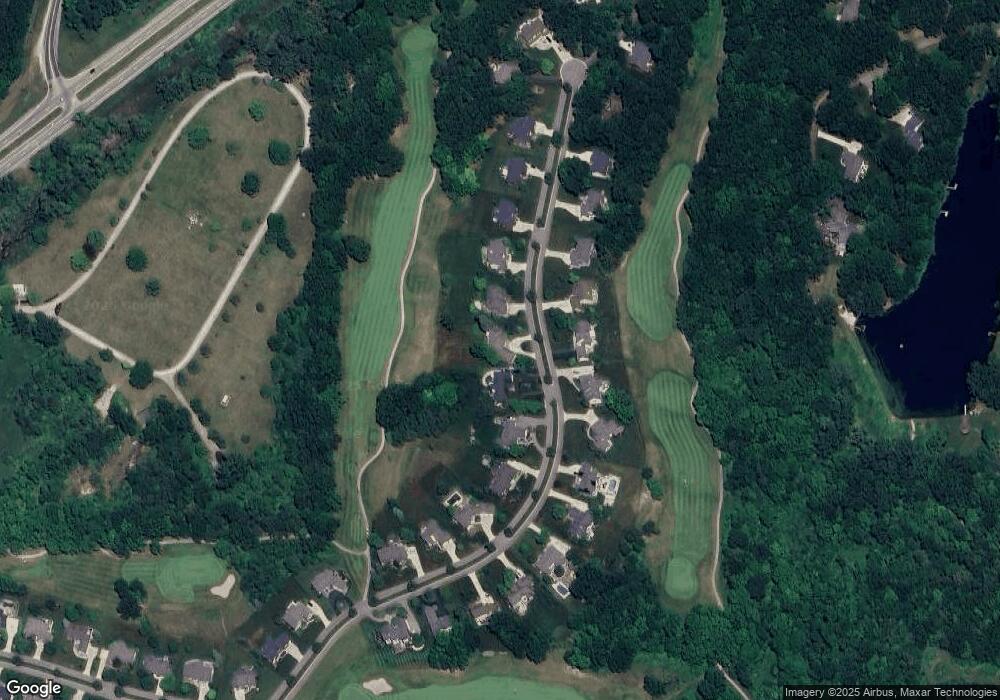
Map
Nearby Homes
- 6300 Boulder Ridge Dr NE
- 4055 Boulder Meadow Dr NE
- 4008 Tom Morris Dr NE Unit 44
- Wilshere Plan at Ravines at Inwood
- Remington Plan at Ravines at Inwood
- Enclave Plan at Ravines at Inwood
- Cascade Plan at Ravines at Inwood
- Croswell Plan at Ravines at Inwood
- Carson Plan at Ravines at Inwood
- Avery Plan at Ravines at Inwood
- Ashton Plan at Ravines at Inwood
- Sycamore Plan at Ravines at Inwood - Woodland Series
- Sequoia Plan at Ravines at Inwood - Woodland Series
- Redwood Plan at Ravines at Inwood - Woodland Series
- Oakwood Plan at Ravines at Inwood - Woodland Series
- Maplewood Plan at Ravines at Inwood - Woodland Series
- Elmwood Plan at Ravines at Inwood - Woodland Series
- Chestnut Plan at Ravines at Inwood - Woodland Series
- Whitby Plan at Ravines at Inwood - Cottage Series
- Camden Plan at Ravines at Inwood - Cottage Series
- 6219 Boulder Ridge Dr NE
- 6207 Boulder Ridge Dr NE
- 6207 Boulder Ridge NE Unit 27
- 6231 Boulder Ridge NE Unit 29
- 4179 Boulder Ridge Dr NE
- 6239 Boulder Ridge Dr NE
- 6239 Boulder Ridge NE Unit 30
- 6185 Boulder Ridge Dr NE Unit 26
- 6185 Boulder Ridge Dr NE
- 6222 Boulder Ridge Dr NE
- 6222 Boulder Ridge Dr NE Unit 22
- 6222 Boulder Ridge NE Unit 44
- 6236 Boulder Ridge NE Unit 43
- 6208 Boulder Ridge NE
- 6251 Boulder Ridge Dr NE
- 6167 Boulder Ridge NE Unit 25
- 6250 Boulder Ridge Dr NE
- 6190 Boulder Ridge NE
- 6135 Boulder Ridge NE
- 6269 Boulder Ridge Dr NE