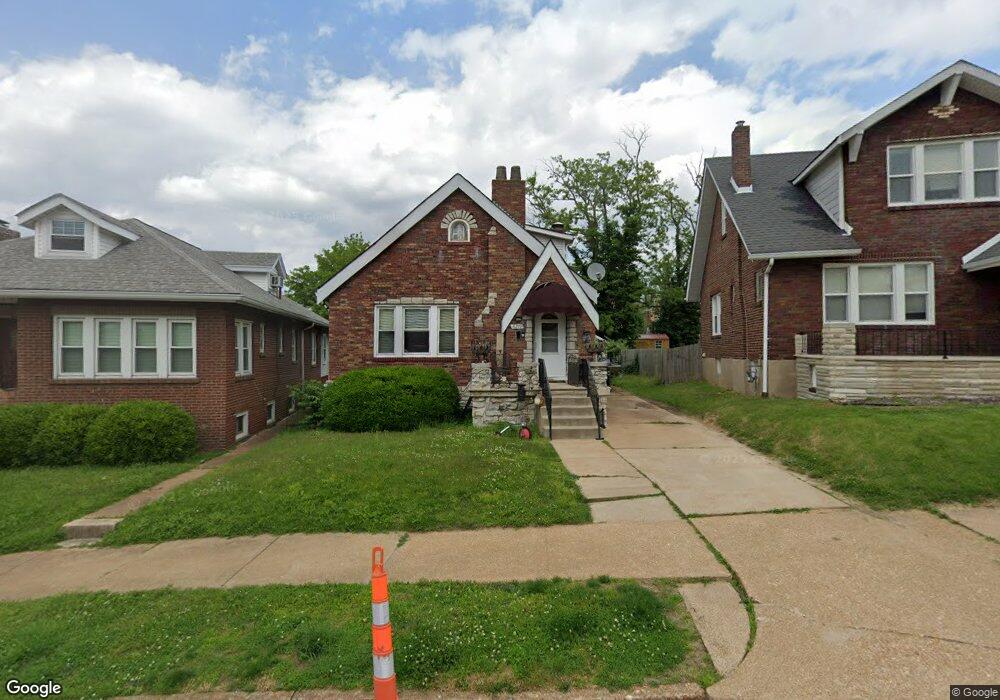
6219 Juniata St Saint Louis, MO 63139
Lindenwood Park NeighborhoodEstimated Value: $274,000 - $303,000
--
Bed
2
Baths
2,200
Sq Ft
$130/Sq Ft
Est. Value
About This Home
This home is located at 6219 Juniata St, Saint Louis, MO 63139 and is currently estimated at $285,191, approximately $129 per square foot. 6219 Juniata St is a home located in St. Louis City with nearby schools including Mason Elementary School, Long International Middle School, and Roosevelt High School.
Ownership History
Date
Name
Owned For
Owner Type
Purchase Details
Closed on
Jan 27, 2020
Sold by
West Tony Reginald and West Kathy
Bought by
West Tony Reginald and West Kathy
Current Estimated Value
Home Financials for this Owner
Home Financials are based on the most recent Mortgage that was taken out on this home.
Original Mortgage
$138,380
Outstanding Balance
$122,758
Interest Rate
3.7%
Mortgage Type
FHA
Estimated Equity
$162,433
Purchase Details
Closed on
Oct 26, 2005
Sold by
Dorman Randall
Bought by
West Tony and West Kathy
Purchase Details
Closed on
Oct 26, 2001
Sold by
Ellison Julie A
Bought by
West Tony and West Kathy
Purchase Details
Closed on
Mar 12, 1999
Sold by
Morgan Keith Winchell & Karen M House
Bought by
Ellison Julie A
Home Financials for this Owner
Home Financials are based on the most recent Mortgage that was taken out on this home.
Original Mortgage
$92,150
Interest Rate
6.5%
Mortgage Type
Assumption
Create a Home Valuation Report for This Property
The Home Valuation Report is an in-depth analysis detailing your home's value as well as a comparison with similar homes in the area
Home Values in the Area
Average Home Value in this Area
Purchase History
| Date | Buyer | Sale Price | Title Company |
|---|---|---|---|
| West Tony Reginald | -- | None Available | |
| West Tony | -- | -- | |
| West Tony | -- | -- | |
| Ellison Julie A | -- | -- |
Source: Public Records
Mortgage History
| Date | Status | Borrower | Loan Amount |
|---|---|---|---|
| Open | West Tony Reginald | $138,380 | |
| Previous Owner | Ellison Julie A | $92,150 |
Source: Public Records
Tax History Compared to Growth
Tax History
| Year | Tax Paid | Tax Assessment Tax Assessment Total Assessment is a certain percentage of the fair market value that is determined by local assessors to be the total taxable value of land and additions on the property. | Land | Improvement |
|---|---|---|---|---|
| 2025 | $3,270 | $45,740 | $3,690 | $42,050 |
| 2024 | $3,111 | $38,730 | $3,690 | $35,040 |
| 2023 | $3,111 | $38,730 | $3,690 | $35,040 |
| 2022 | $2,967 | $35,550 | $3,690 | $31,860 |
| 2021 | $2,962 | $35,550 | $3,690 | $31,860 |
| 2020 | $2,768 | $33,460 | $3,690 | $29,770 |
| 2019 | $2,759 | $33,460 | $3,690 | $29,770 |
| 2018 | $2,575 | $30,250 | $3,270 | $26,980 |
| 2017 | $2,531 | $30,250 | $3,270 | $26,980 |
| 2016 | $2,160 | $25,440 | $3,270 | $22,170 |
| 2015 | $1,959 | $25,440 | $3,270 | $22,170 |
| 2014 | $1,860 | $25,440 | $3,270 | $22,170 |
| 2013 | -- | $24,150 | $3,270 | $20,880 |
Source: Public Records
Map
Nearby Homes
- 6023 Arsenal St
- 6426 Arsenal St
- 6012 Odell St
- 6439 Arsenal St
- 6266 Marmaduke Ave
- 6036 Arsenal St
- 6005 Juniata St
- 5977 Arsenal St
- 3159 Hampton Ave
- 5962 S Cuba Ct
- 2817 Knox Ct
- 6445 Odell St
- 6315 Bradley Ave
- 6020 Southwest Ave
- 5909 Juniata St
- 3282 Watson Rd
- 6133 Magnolia Ave
- 5918 Southwest Ave
- 6285 Magnolia Ave
- 6300 Fyler Ave
- 6215 Juniata St
- 6223 Juniata St
- 3145 Watson Rd
- 6229 Juniata St
- 3147 Watson Rd
- 6222 Juniata St
- 6226 Juniata St
- 3121 Watson Rd
- 3149 Watson Rd
- 6303 Juniata St
- 6226 Arsenal St
- 6222 Arsenal St
- 6228 Arsenal St
- 6228 Arsenal St Unit 1F
- 6220 Juniata St
- 6218 Arsenal St
- 6232 Arsenal St
- 6304 Juniata St
- 6304 Juniata St
- 6236 Arsenal St