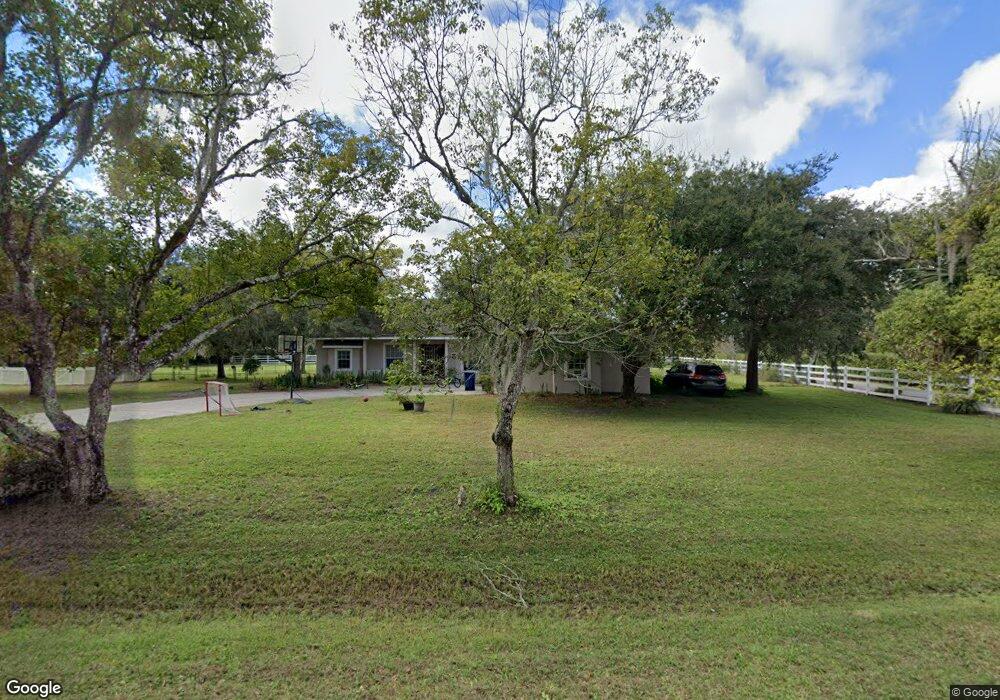
6219 Tower Rd Land O Lakes, FL 34638
Estimated Value: $595,000 - $796,000
4
Beds
3
Baths
3,735
Sq Ft
$183/Sq Ft
Est. Value
About This Home
This home is located at 6219 Tower Rd, Land O Lakes, FL 34638 and is currently estimated at $681,793, approximately $182 per square foot. 6219 Tower Rd is a home located in Pasco County with nearby schools including Connerton Elementary School, Pine View Middle School, and Land O' Lakes High School.
Ownership History
Date
Name
Owned For
Owner Type
Purchase Details
Closed on
Nov 22, 2013
Sold by
Buchman Jacob M
Bought by
Weller Christopher H and Weller Kimberly D
Current Estimated Value
Home Financials for this Owner
Home Financials are based on the most recent Mortgage that was taken out on this home.
Original Mortgage
$281,934
Outstanding Balance
$209,667
Interest Rate
4.16%
Mortgage Type
VA
Estimated Equity
$472,126
Purchase Details
Closed on
Dec 29, 2011
Sold by
Buchman Steven J and Parkin Buchman Kristina Dawn
Bought by
Buchman Jacob M
Purchase Details
Closed on
Mar 4, 2005
Sold by
Winkler Bernard and Winkler Lynn J
Bought by
Buchman Steven J and Parkin Buchman Kristina Dawn
Home Financials for this Owner
Home Financials are based on the most recent Mortgage that was taken out on this home.
Original Mortgage
$303,974
Interest Rate
5.6%
Mortgage Type
Unknown
Create a Home Valuation Report for This Property
The Home Valuation Report is an in-depth analysis detailing your home's value as well as a comparison with similar homes in the area
Home Values in the Area
Average Home Value in this Area
Purchase History
| Date | Buyer | Sale Price | Title Company |
|---|---|---|---|
| Weller Christopher H | $276,000 | American Home Title Of Tampa | |
| Buchman Jacob M | $150,000 | Attorney | |
| Buchman Steven J | $300,000 | Linsky & Reiber Real Estate |
Source: Public Records
Mortgage History
| Date | Status | Borrower | Loan Amount |
|---|---|---|---|
| Open | Weller Christopher H | $281,934 | |
| Previous Owner | Buchman Steven J | $303,974 |
Source: Public Records
Tax History Compared to Growth
Tax History
| Year | Tax Paid | Tax Assessment Tax Assessment Total Assessment is a certain percentage of the fair market value that is determined by local assessors to be the total taxable value of land and additions on the property. | Land | Improvement |
|---|---|---|---|---|
| 2025 | $3,730 | $256,120 | -- | -- |
| 2024 | $3,730 | $248,910 | -- | -- |
| 2023 | $3,590 | $241,660 | $0 | $0 |
| 2022 | $3,222 | $234,630 | $0 | $0 |
| 2021 | $3,160 | $227,800 | $45,589 | $182,211 |
| 2020 | $3,109 | $224,660 | $45,589 | $179,071 |
| 2019 | $3,055 | $219,610 | $0 | $0 |
| 2018 | $2,997 | $215,519 | $0 | $0 |
| 2017 | $2,983 | $215,519 | $0 | $0 |
| 2016 | $2,913 | $206,744 | $0 | $0 |
| 2015 | $2,953 | $205,307 | $0 | $0 |
| 2014 | $2,872 | $203,678 | $45,589 | $158,089 |
Source: Public Records
Map
Nearby Homes
- 6295 Tower Rd
- 20735 Gardenia Dr
- 21018 Little Lake Thomas Rd
- 21121 Little Lake Thomas Rd
- 6274 Shiner St
- 6246 Shiner St
- 6144 Shiner St
- 6539 La Mesa Rd
- 6544 La Mesa Rd
- 21034 Lirio Dr
- 6621 La Mesa Rd
- 21012 Picasso Ct Unit J201
- 21012 Picasso Ct Unit J205
- 21372 Darter Rd
- 21395 Darter Rd
- 6105 Land O' Lakes Blvd Unit 1
- 6105 Land O' Lakes Blvd Unit 20
- 6801 Dali Ave Unit G104
- 20402 Monza Loop
- 21205 Calle Rosa Dr Unit 10
- 6249 Tower Rd
- 6205 Tower Rd
- 6222 Tower Rd
- 20731 Nolen Rd
- 6242 Tower Rd
- 20742 Nolen Rd
- 20730 Nolen Rd
- 6229 Tower Rd
- 6328 Tower Rd
- 6324 Tower Rd
- 6319 Tower Rd
- 6327 Tower Rd
- 6105 Tower Rd
- 20718 Nolen Rd
- 6239 Tower Rd
- 6236 Tower Rd
- 20907 Ragan Ln
- 20751 Gardenia Dr
- 20948 Little Lake Thomas Rd
- 20928 Little Lake Thomas Rd