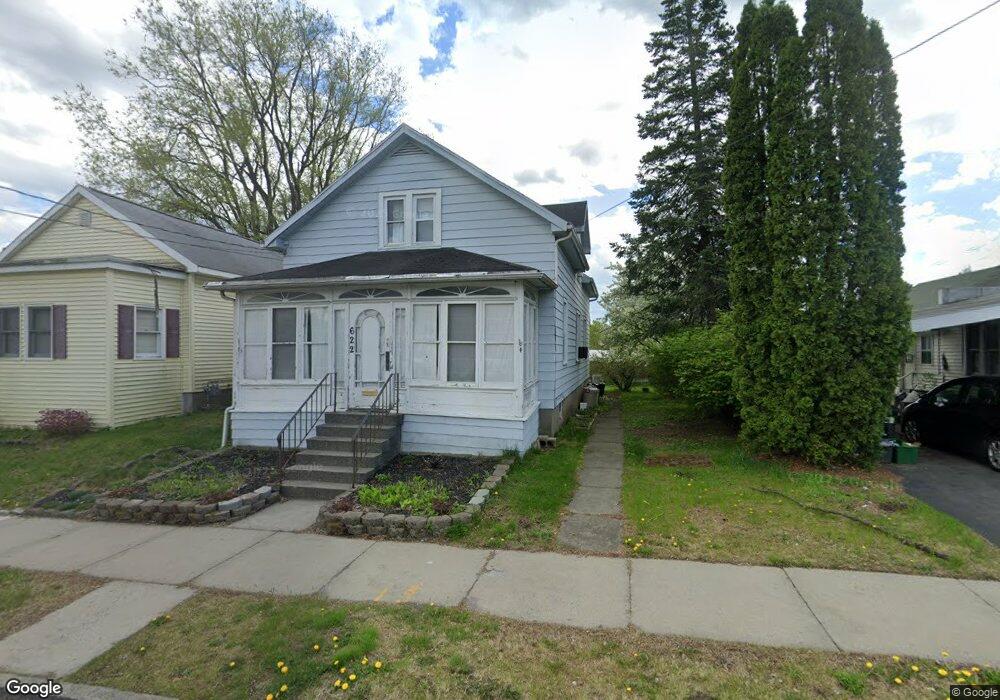
622 4th St Watervliet, NY 12189
Estimated Value: $215,000 - $296,000
3
Beds
2
Baths
1,518
Sq Ft
$160/Sq Ft
Est. Value
About This Home
This home is located at 622 4th St, Watervliet, NY 12189 and is currently estimated at $243,505, approximately $160 per square foot. 622 4th St is a home located in Albany County with nearby schools including Watervliet Elementary School, Watervliet Junior/Senior High School, and KIPP Troy Prep High School.
Ownership History
Date
Name
Owned For
Owner Type
Purchase Details
Closed on
Apr 2, 2010
Sold by
Steinberg David L and Steinberg Seth A
Bought by
Steinberg Seth A
Current Estimated Value
Purchase Details
Closed on
Sep 26, 2006
Sold by
Steinberg Robert
Bought by
Steinberg Robert
Purchase Details
Closed on
Oct 24, 2001
Sold by
Estate-Holland Robert N
Bought by
Steinberg Robert
Create a Home Valuation Report for This Property
The Home Valuation Report is an in-depth analysis detailing your home's value as well as a comparison with similar homes in the area
Home Values in the Area
Average Home Value in this Area
Purchase History
| Date | Buyer | Sale Price | Title Company |
|---|---|---|---|
| Steinberg Seth A | -- | None Available | |
| Steinberg Robert | -- | -- | |
| Steinberg Robert | $60,000 | William Bates |
Source: Public Records
Tax History
| Year | Tax Paid | Tax Assessment Tax Assessment Total Assessment is a certain percentage of the fair market value that is determined by local assessors to be the total taxable value of land and additions on the property. | Land | Improvement |
|---|---|---|---|---|
| 2025 | $3,973 | $116,600 | $28,800 | $87,800 |
| 2024 | $3,973 | $116,600 | $28,800 | $87,800 |
| 2023 | $3,792 | $116,600 | $28,800 | $87,800 |
| 2022 | $3,633 | $116,600 | $28,800 | $87,800 |
| 2021 | $3,592 | $116,600 | $28,800 | $87,800 |
| 2020 | $3,478 | $116,600 | $28,800 | $87,800 |
| 2019 | $3,617 | $116,600 | $28,800 | $87,800 |
| 2018 | $3,387 | $116,600 | $28,800 | $87,800 |
| 2017 | $3,123 | $116,600 | $28,800 | $87,800 |
| 2016 | $3,036 | $116,600 | $28,800 | $87,800 |
| 2015 | -- | $125,000 | $28,800 | $96,200 |
| 2014 | -- | $125,000 | $28,800 | $96,200 |
Source: Public Records
Map
Nearby Homes
Your Personal Tour Guide
Ask me questions while you tour the home.