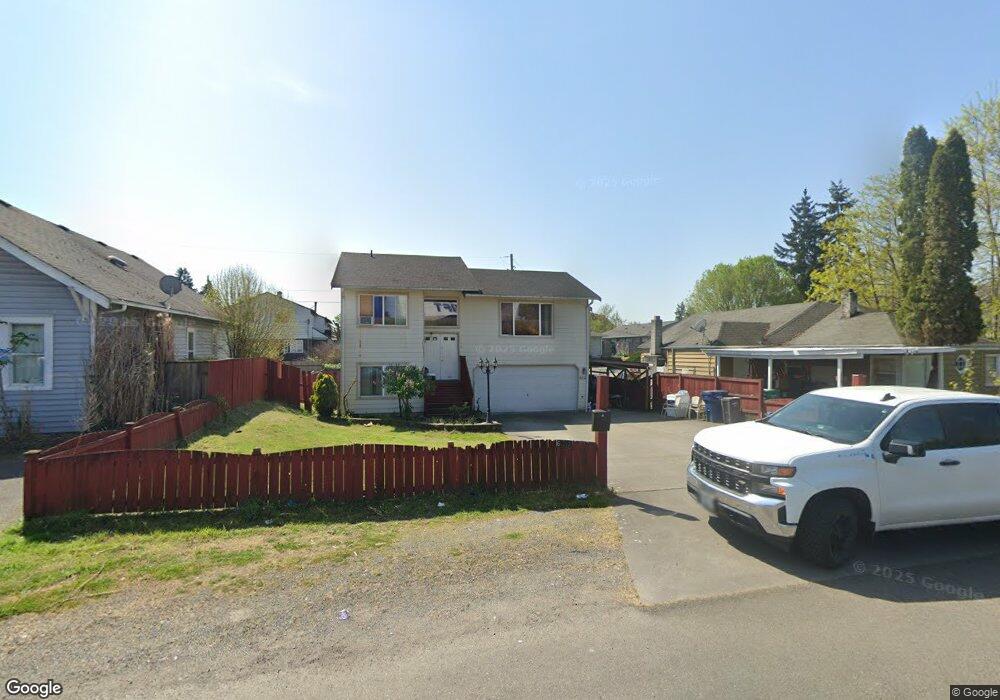
622 5th St SE Auburn, WA 98002
South Auburn NeighborhoodEstimated Value: $459,000 - $515,000
3
Beds
2
Baths
1,320
Sq Ft
$374/Sq Ft
Est. Value
About This Home
This home is located at 622 5th St SE, Auburn, WA 98002 and is currently estimated at $493,777, approximately $374 per square foot. 622 5th St SE is a home located in King County with nearby schools including Terminal Park Elementary School, Olympic Middle School, and Auburn High School.
Ownership History
Date
Name
Owned For
Owner Type
Purchase Details
Closed on
May 3, 2004
Sold by
Mccammant Homes Inc
Bought by
Raj Sanjay and Raj Sharika
Current Estimated Value
Home Financials for this Owner
Home Financials are based on the most recent Mortgage that was taken out on this home.
Original Mortgage
$138,750
Outstanding Balance
$64,504
Interest Rate
5.38%
Mortgage Type
Stand Alone First
Estimated Equity
$429,273
Purchase Details
Closed on
Dec 5, 2003
Sold by
Brown William J and Brown Karen J
Bought by
Mccammant Homes Inc
Home Financials for this Owner
Home Financials are based on the most recent Mortgage that was taken out on this home.
Original Mortgage
$148,000
Interest Rate
5.81%
Mortgage Type
Purchase Money Mortgage
Purchase Details
Closed on
Feb 6, 1990
Sold by
Brown William J
Bought by
Brown William J and Brown Karen J
Create a Home Valuation Report for This Property
The Home Valuation Report is an in-depth analysis detailing your home's value as well as a comparison with similar homes in the area
Home Values in the Area
Average Home Value in this Area
Purchase History
| Date | Buyer | Sale Price | Title Company |
|---|---|---|---|
| Raj Sanjay | $196,000 | Ticor Title | |
| Mccammant Homes Inc | $65,000 | Lawyers Title | |
| Brown William J | -- | -- |
Source: Public Records
Mortgage History
| Date | Status | Borrower | Loan Amount |
|---|---|---|---|
| Open | Raj Sanjay | $138,750 | |
| Previous Owner | Mccammant Homes Inc | $148,000 |
Source: Public Records
Tax History Compared to Growth
Tax History
| Year | Tax Paid | Tax Assessment Tax Assessment Total Assessment is a certain percentage of the fair market value that is determined by local assessors to be the total taxable value of land and additions on the property. | Land | Improvement |
|---|---|---|---|---|
| 2024 | $5,341 | $443,000 | $98,000 | $345,000 |
| 2023 | $4,975 | $397,000 | $79,000 | $318,000 |
| 2022 | $4,464 | $415,000 | $86,000 | $329,000 |
| 2021 | $4,303 | $330,000 | $69,000 | $261,000 |
| 2020 | $3,922 | $301,000 | $65,000 | $236,000 |
| 2018 | $4,504 | $313,000 | $72,000 | $241,000 |
| 2017 | $3,670 | $286,000 | $66,000 | $220,000 |
| 2016 | $3,058 | $231,000 | $60,000 | $171,000 |
| 2015 | $3,013 | $203,000 | $56,000 | $147,000 |
| 2014 | -- | $194,000 | $53,000 | $141,000 |
| 2013 | -- | $154,000 | $49,000 | $105,000 |
Source: Public Records
Map
Nearby Homes