A
Seller's Agent in 2021
Alexander Shirah
Hinesville Military Homes
Estimated Value: $463,000 - $511,237
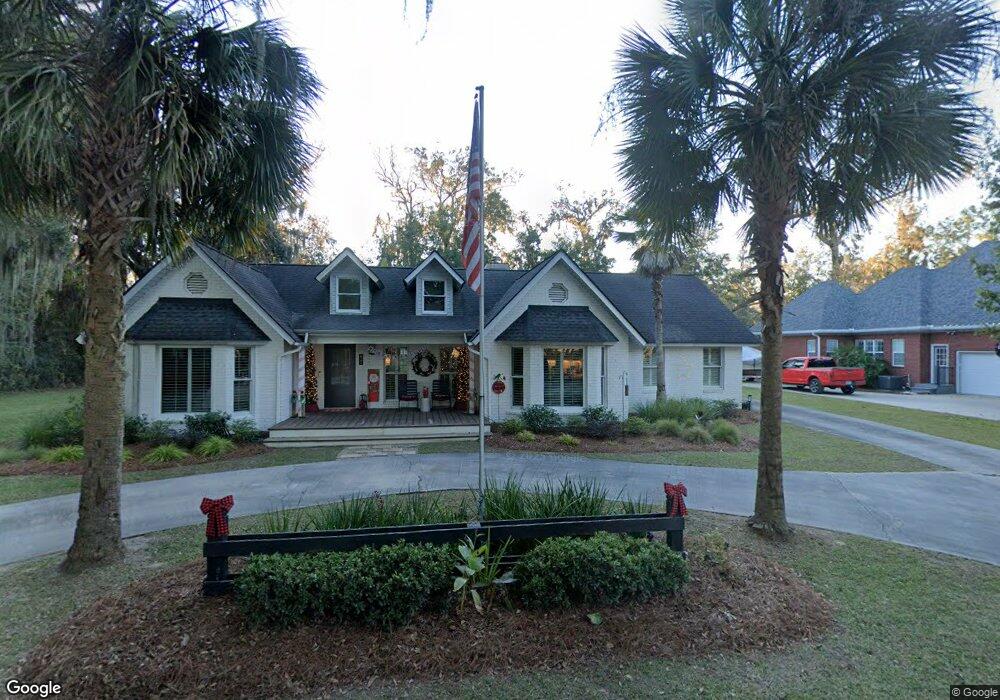
Come check out this beautiful Georgia coastal home with a Clear view of the ocean from your front porch. This home has an open living room with a large french door opening to your beautiful wood deck and privacy fenced courtyard. A breeze way from the laundry room leads to a huge media room with two accesses into the finished heated and cooled attic playroom for children. Garage is large enough to park two full sized SUVs and still have area for your work shop and a detached parking for your boat. Master bathroom has a whirlpool tub and separate shower. Home also has plantation shutters
| Date | Buyer | Sale Price | Title Company |
|---|---|---|---|
| Grenchik Brian | $346,002 | -- | |
| Ackles Eric R | $206,750 | -- | |
| Smith Lyndia K | $30,000 | -- |
| Date | Status | Borrower | Loan Amount |
|---|---|---|---|
| Open | Grenchik Brian | $311,401 | |
| Previous Owner | Ackles Eric R | $213,572 |
| Date | Event | Price | List to Sale | Price per Sq Ft | Prior Sale |
|---|---|---|---|---|---|
| 07/12/2021 07/12/21 | Sold | $346,002 | +4.8% | $122 / Sq Ft | View Prior Sale |
| 06/01/2021 06/01/21 | Pending | -- | -- | -- | |
| 05/28/2021 05/28/21 | For Sale | $330,000 | -- | $117 / Sq Ft |
| Year | Tax Paid | Tax Assessment Tax Assessment Total Assessment is a certain percentage of the fair market value that is determined by local assessors to be the total taxable value of land and additions on the property. | Land | Improvement |
|---|---|---|---|---|
| 2024 | $7,005 | $188,708 | $18,400 | $170,308 |
| 2023 | $7,005 | $168,712 | $20,000 | $148,712 |
| 2022 | $5,378 | $141,715 | $20,000 | $121,715 |
| 2021 | $3,373 | $86,654 | $15,200 | $71,454 |
| 2020 | $3,172 | $78,141 | $15,200 | $62,941 |
| 2019 | $3,008 | $78,948 | $15,200 | $63,748 |
| 2018 | $3,002 | $79,755 | $15,200 | $64,555 |
| 2017 | $2,653 | $80,562 | $15,200 | $65,362 |
| 2016 | $2,852 | $81,369 | $15,200 | $66,169 |
| 2015 | $3,246 | $84,520 | $15,200 | $69,320 |
| 2014 | $3,246 | $88,472 | $15,200 | $73,272 |
| 2013 | -- | $89,585 | $15,200 | $74,385 |
A
Seller's Agent in 2021
Alexander Shirah
Hinesville Military Homes

Buyer's Agent in 2021
Dee Moncrief
Coast & Country RE Experts
(912) 433-7881
24 Total Sales