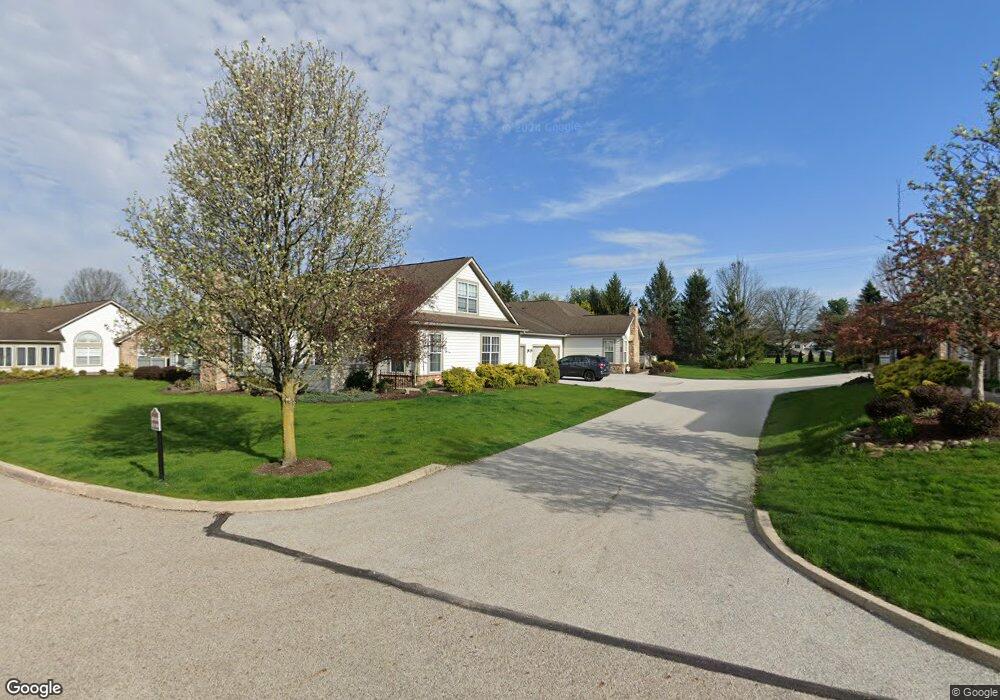
622 Crossings Cir Unit 622 Tallmadge, OH 44278
Estimated Value: $226,000 - $235,000
3
Beds
3
Baths
1,325
Sq Ft
$173/Sq Ft
Est. Value
About This Home
This home is located at 622 Crossings Cir Unit 622, Tallmadge, OH 44278 and is currently estimated at $229,255, approximately $173 per square foot. 622 Crossings Cir Unit 622 is a home located in Summit County with nearby schools including Tallmadge Middle School, Tallmadge High School, and Steel Academy.
Ownership History
Date
Name
Owned For
Owner Type
Purchase Details
Closed on
Jan 28, 2011
Sold by
Federal Home Loan Mortgage Corporation
Bought by
Doamekpor Francois K
Current Estimated Value
Home Financials for this Owner
Home Financials are based on the most recent Mortgage that was taken out on this home.
Original Mortgage
$111,986
Interest Rate
5.04%
Mortgage Type
FHA
Purchase Details
Closed on
Jul 23, 2010
Sold by
Bohrer Howard F
Bought by
Federal Home Loan Mortgage Corp
Purchase Details
Closed on
Mar 9, 2007
Sold by
Crossings At Northwest Summit County Llc
Bought by
Bohrer Howard F
Home Financials for this Owner
Home Financials are based on the most recent Mortgage that was taken out on this home.
Original Mortgage
$160,200
Interest Rate
6.27%
Mortgage Type
Unknown
Create a Home Valuation Report for This Property
The Home Valuation Report is an in-depth analysis detailing your home's value as well as a comparison with similar homes in the area
Home Values in the Area
Average Home Value in this Area
Purchase History
| Date | Buyer | Sale Price | Title Company |
|---|---|---|---|
| Doamekpor Francois K | $114,900 | Attorney | |
| Federal Home Loan Mortgage Corp | $112,000 | None Available | |
| Bohrer Howard F | $178,000 | Lawyers Title Ins |
Source: Public Records
Mortgage History
| Date | Status | Borrower | Loan Amount |
|---|---|---|---|
| Previous Owner | Doamekpor Francois K | $111,986 | |
| Previous Owner | Bohrer Howard F | $160,200 |
Source: Public Records
Tax History Compared to Growth
Tax History
| Year | Tax Paid | Tax Assessment Tax Assessment Total Assessment is a certain percentage of the fair market value that is determined by local assessors to be the total taxable value of land and additions on the property. | Land | Improvement |
|---|---|---|---|---|
| 2025 | $3,081 | $61,776 | $4,967 | $56,809 |
| 2024 | $3,081 | $61,776 | $4,967 | $56,809 |
| 2023 | $3,081 | $61,776 | $4,967 | $56,809 |
| 2022 | $3,115 | $51,055 | $4,106 | $46,949 |
| 2021 | $3,129 | $51,055 | $4,106 | $46,949 |
| 2020 | $3,104 | $51,060 | $4,110 | $46,950 |
| 2019 | $2,894 | $42,560 | $3,980 | $38,580 |
| 2018 | $2,550 | $42,570 | $3,940 | $38,630 |
| 2017 | $2,296 | $42,570 | $3,940 | $38,630 |
| 2016 | $2,477 | $38,000 | $3,940 | $34,060 |
| 2015 | $2,296 | $38,000 | $3,940 | $34,060 |
| 2014 | $2,280 | $38,000 | $3,940 | $34,060 |
| 2013 | $2,733 | $46,380 | $5,060 | $41,320 |
Source: Public Records
Map
Nearby Homes
- 610 Crossings Cir Unit 610
- 400 Cherry Ridge
- 518 Morningstar Dr Unit 518
- 430 Cherry Ridge Unit 54
- 538 Morningstar Dr Unit 538
- 370 Cherry Ridge Unit 60
- 441 Cherry Ridge Unit 52
- 1444 Wellingshire Cir Unit 32B
- 331 Cherry Ridge Unit 45
- 399 N Thomas Rd
- 823 Gardenstone Cir
- 1625 Queens Gate Cir Unit 1D1625
- 341 Starr Line Dr
- 1276 Bailey Rd
- 211 Cherry Ridge Unit 33
- 965 Elizabeth Ct
- 528 Fernwood Ave
- 1512 Bancroft St
- 955 Davis Ave
- 1512 Treasch Dr
- 626 Crossings Cir Unit 626
- 620 Crossings Cir Unit 620
- 624 Crossings Cir Unit 624
- 616 Crossings Cir Unit 616
- 614 Crossings Cir Unit 614
- 612 Crossings Cir Unit 612
- 632 Crossings Cir
- 630 Crossings Cir Unit 630
- 636 Crossings Cir Unit 636
- 634 Crossings Cir Unit 634
- 625 Crossings Cir Unit 625
- 621 Crossings Cir Unit 621
- 611 Crossings Cir Unit 611
- 631 Crossings Cir Unit 631
- 606 Crossings Cir Unit 606
- 604 Crossings Cir Unit 604
- 627 Crossings Cir Unit 627
- 635 Crossings Cir Unit 635
- 617 Crossings Cir Unit 617
- 623 Crossings Cir Unit 623