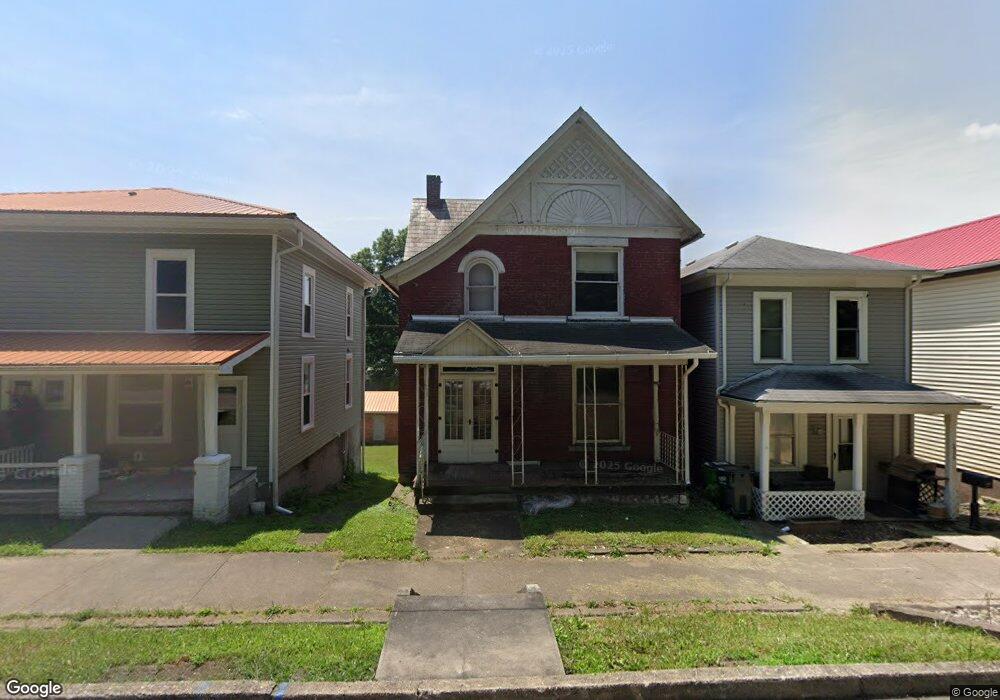
622 Grant St Dennison, OH 44621
Estimated Value: $55,000 - $713,000
4
Beds
2
Baths
2,040
Sq Ft
$111/Sq Ft
Est. Value
About This Home
This home is located at 622 Grant St, Dennison, OH 44621 and is currently estimated at $226,730, approximately $111 per square foot. 622 Grant St is a home located in Tuscarawas County with nearby schools including Claymont High School and Immaculate Conception School.
Ownership History
Date
Name
Owned For
Owner Type
Purchase Details
Closed on
Mar 12, 2024
Sold by
Fixed Up Properties Llc
Bought by
Rufener Ryan
Current Estimated Value
Home Financials for this Owner
Home Financials are based on the most recent Mortgage that was taken out on this home.
Original Mortgage
$44,000
Outstanding Balance
$43,095
Interest Rate
6.63%
Mortgage Type
Credit Line Revolving
Estimated Equity
$183,635
Purchase Details
Closed on
Apr 6, 2022
Sold by
Albery Stephen W and Albery Elizabeth
Bought by
Fixed Up Properties Llc
Purchase Details
Closed on
Jan 5, 1987
Sold by
Paris Edward L and Paris Sherry L
Bought by
Albery Stephen W and Albery Elizabeth
Create a Home Valuation Report for This Property
The Home Valuation Report is an in-depth analysis detailing your home's value as well as a comparison with similar homes in the area
Home Values in the Area
Average Home Value in this Area
Purchase History
| Date | Buyer | Sale Price | Title Company |
|---|---|---|---|
| Rufener Ryan | $62,000 | Ohio Real Title | |
| Fixed Up Properties Llc | $31,500 | Ohio Real Title | |
| Albery Stephen W | $5,000 | -- |
Source: Public Records
Mortgage History
| Date | Status | Borrower | Loan Amount |
|---|---|---|---|
| Open | Rufener Ryan | $44,000 |
Source: Public Records
Tax History
| Year | Tax Paid | Tax Assessment Tax Assessment Total Assessment is a certain percentage of the fair market value that is determined by local assessors to be the total taxable value of land and additions on the property. | Land | Improvement |
|---|---|---|---|---|
| 2024 | $380 | $29,040 | $11,500 | $17,540 |
| 2023 | $380 | $29,040 | $11,500 | $17,540 |
| 2022 | $385 | $10,164 | $4,025 | $6,139 |
| 2021 | $564 | $13,969 | $3,052 | $10,917 |
| 2020 | $575 | $13,969 | $3,052 | $10,917 |
| 2019 | $552 | $13,969 | $3,052 | $10,917 |
| 2018 | $489 | $11,790 | $2,580 | $9,210 |
| 2017 | $516 | $11,790 | $2,580 | $9,210 |
| 2016 | $513 | $11,790 | $2,580 | $9,210 |
| 2014 | $570 | $13,000 | $2,450 | $10,550 |
| 2013 | $576 | $13,000 | $2,450 | $10,550 |
Source: Public Records
Map
Nearby Homes
Your Personal Tour Guide
Ask me questions while you tour the home.