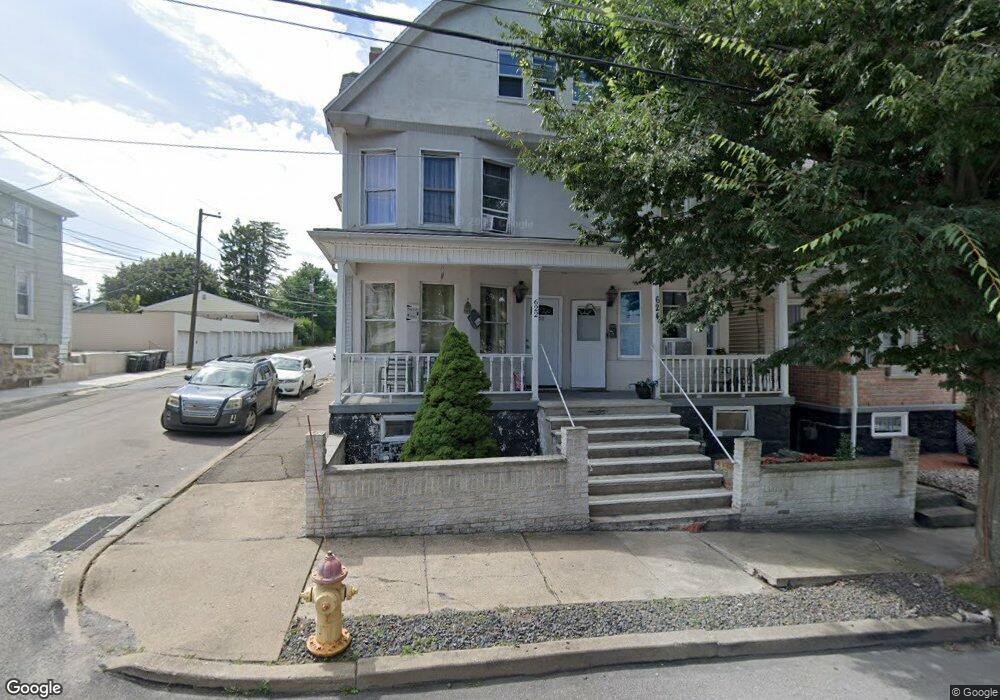
622 Grant St Hazleton, PA 18201
Estimated Value: $126,000 - $201,000
Studio
--
Bath
1,582
Sq Ft
$103/Sq Ft
Est. Value
About This Home
This home is located at 622 Grant St, Hazleton, PA 18201 and is currently estimated at $162,224, approximately $102 per square foot. 622 Grant St is a home located in Luzerne County with nearby schools including Hazleton Area High School, Immanuel Christian School, and Holy Family Academy.
Ownership History
Date
Name
Owned For
Owner Type
Purchase Details
Closed on
Jan 8, 2026
Sold by
Sanchez Juan M Duran and De Duran Dianka
Bought by
Sanchez Juan M Duran
Current Estimated Value
Purchase Details
Closed on
May 18, 2020
Sold by
American Note Capital Llc
Bought by
Sanchez Juan M Duran and Dedufan Danka Y
Purchase Details
Closed on
Feb 12, 2018
Sold by
Harbour Portfolio Vi Lp
Bought by
American Note Capital Llc
Purchase Details
Closed on
Apr 7, 2011
Sold by
Fannie Mae
Bought by
Harbour Portfolio Vi Lp
Purchase Details
Closed on
Nov 23, 2010
Sold by
Plancencia Optaciano
Bought by
Federal National Mortgage Association
Purchase Details
Closed on
May 4, 2006
Sold by
Mcnelis Terrence A and Mcnelis Susan
Bought by
Plancencia Optaciano
Home Financials for this Owner
Home Financials are based on the most recent Mortgage that was taken out on this home.
Original Mortgage
$45,600
Interest Rate
6.42%
Mortgage Type
New Conventional
Create a Home Valuation Report for This Property
The Home Valuation Report is an in-depth analysis detailing your home's value as well as a comparison with similar homes in the area
Home Values in the Area
Average Home Value in this Area
Purchase History
| Date | Buyer | Sale Price | Title Company |
|---|---|---|---|
| Sanchez Juan M Duran | -- | Toma Abstract | |
| Sanchez Juan M Duran | $43,100 | None Available | |
| American Note Capital Llc | $29,908 | None Available | |
| Harbour Portfolio Vi Lp | $10,499 | None Available | |
| Federal National Mortgage Association | $1,071 | None Available | |
| Plancencia Optaciano | $57,000 | None Available |
Source: Public Records
Mortgage History
| Date | Status | Borrower | Loan Amount |
|---|---|---|---|
| Previous Owner | Plancencia Optaciano | $45,600 |
Source: Public Records
Tax History
| Year | Tax Paid | Tax Assessment Tax Assessment Total Assessment is a certain percentage of the fair market value that is determined by local assessors to be the total taxable value of land and additions on the property. | Land | Improvement |
|---|---|---|---|---|
| 2025 | $1,925 | $67,000 | $20,400 | $46,600 |
| 2024 | $1,803 | $67,000 | $20,400 | $46,600 |
| 2023 | $1,686 | $67,000 | $20,400 | $46,600 |
| 2022 | $1,673 | $67,000 | $20,400 | $46,600 |
| 2021 | $1,635 | $67,000 | $20,400 | $46,600 |
| 2020 | $1,460 | $67,000 | $20,400 | $46,600 |
| 2019 | $1,507 | $67,000 | $20,400 | $46,600 |
| 2018 | $1,456 | $67,000 | $20,400 | $46,600 |
| 2017 | $1,342 | $67,000 | $20,400 | $46,600 |
| 2016 | $954 | $67,000 | $20,400 | $46,600 |
| 2015 | -- | $67,000 | $20,400 | $46,600 |
| 2014 | -- | $67,000 | $20,400 | $46,600 |
Source: Public Records
Map
Nearby Homes
- 608 Mckinley St
- 590 Mckinley St
- 1 W Diamond Ave
- 1087 N Rear Locust St
- 118 E Green St
- 714 Alter St
- 60 E Jefferson Ave
- 403 W 7th St
- 360 W Spruce St
- 882 N Locust St
- 864 Alter St
- 121 N Church St
- 827 N Vine St
- 127 W Diamond Ave
- 829 W 21st St
- 239 Lincalis St
- 56 N Laurel St
- 52 N Laurel St
- 14 W 4th St
- 897 N Vine St