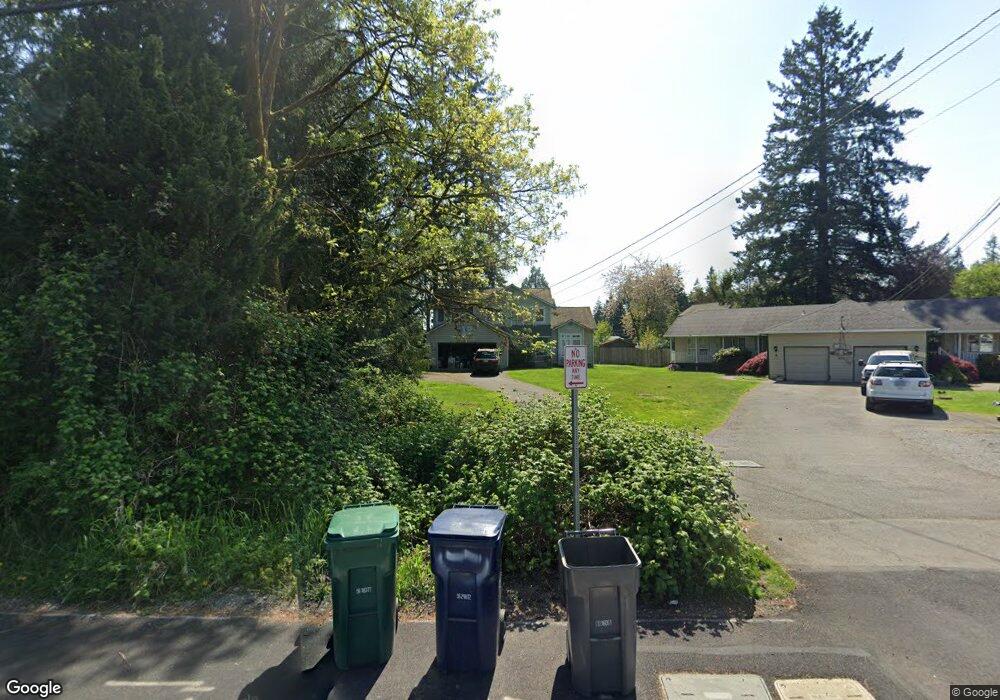
622 Harvest Rd Bothell, WA 98012
Queensborough-Brentwood NeighborhoodEstimated Value: $920,000 - $985,000
3
Beds
3
Baths
1,751
Sq Ft
$543/Sq Ft
Est. Value
About This Home
This home is located at 622 Harvest Rd, Bothell, WA 98012 and is currently estimated at $951,048, approximately $543 per square foot. 622 Harvest Rd is a home located in Snohomish County with nearby schools including Crystal Springs Elementary School, Canyon Park Junior High School, and Bothell High School.
Ownership History
Date
Name
Owned For
Owner Type
Purchase Details
Closed on
Dec 23, 2002
Sold by
Floyd Dennis L and Floyd Helen R
Bought by
Brooks Jennifer E
Current Estimated Value
Purchase Details
Closed on
Nov 3, 1997
Sold by
Floyd Dennis L
Bought by
Floyd Dennis L and Garcia Helen R
Home Financials for this Owner
Home Financials are based on the most recent Mortgage that was taken out on this home.
Original Mortgage
$157,900
Interest Rate
7.26%
Purchase Details
Closed on
Oct 12, 1993
Sold by
Michel Robin W and Michel Karen E
Bought by
Floyd Dennis L
Home Financials for this Owner
Home Financials are based on the most recent Mortgage that was taken out on this home.
Original Mortgage
$157,450
Interest Rate
6.94%
Create a Home Valuation Report for This Property
The Home Valuation Report is an in-depth analysis detailing your home's value as well as a comparison with similar homes in the area
Home Values in the Area
Average Home Value in this Area
Purchase History
| Date | Buyer | Sale Price | Title Company |
|---|---|---|---|
| Brooks Jennifer E | $266,500 | Chicago | |
| Floyd Dennis L | -- | Fidelity National Title | |
| Floyd Dennis L | $174,950 | First American Title |
Source: Public Records
Mortgage History
| Date | Status | Borrower | Loan Amount |
|---|---|---|---|
| Previous Owner | Floyd Dennis L | $157,900 | |
| Previous Owner | Floyd Dennis L | $157,450 |
Source: Public Records
Tax History
| Year | Tax Paid | Tax Assessment Tax Assessment Total Assessment is a certain percentage of the fair market value that is determined by local assessors to be the total taxable value of land and additions on the property. | Land | Improvement |
|---|---|---|---|---|
| 2025 | $6,118 | $746,400 | $490,000 | $256,400 |
| 2024 | $6,118 | $727,500 | $480,000 | $247,500 |
| 2023 | $6,301 | $816,400 | $530,000 | $286,400 |
| 2022 | $5,902 | $612,100 | $369,000 | $243,100 |
| 2020 | $5,167 | $497,800 | $289,000 | $208,800 |
| 2019 | $4,268 | $420,000 | $247,000 | $173,000 |
| 2018 | $3,983 | $369,400 | $215,000 | $154,400 |
| 2017 | $3,396 | $323,000 | $180,000 | $143,000 |
| 2016 | $3,206 | $295,000 | $158,000 | $137,000 |
Source: Public Records
Map
Nearby Homes
- 20029 7th Ave SE
- 727 198th Place SE
- 820 Grimes Rd
- 429 203rd Place SE
- 19726 Filbert Dr
- 19921 10th Dr SE
- 20224 11th Dr SE
- 1126 199th St SE
- 24 199th Place SE
- 603 194th Place SE
- 1216 199th St SE
- 105 202nd St SE
- 20511 Greening Rd
- 309 207th Place SE
- 1402 194th St SE Unit 1
- 300 208th St SE
- 1322 194th St SE Unit B4
- 1322 194th St SE Unit B7
- 1322 194th St SE Unit B2
- 1322 194th St SE Unit B1
- 620 Harvest Rd
- 620 Harvest Rd Unit A
- 0 Harvest Trails St Unit 37183654
- 0 Harvest Trails St Unit 37183518
- 0 Harvest Trails St Unit 37183643
- 0 Harvest Trails St Unit 37183645
- 0 Harvest Trails St Unit 37183636
- 0 Harvest Trails St Unit 37183638
- 702 Harvest Rd
- 19927 Filbert Dr
- 618 Harvest Rd
- 19925 Filbert Dr
- 19923 Filbert Dr
- 19917 Filbert Dr
- 623 Harvest Rd
- 633 Harvest Rd
- 615 Harvest Rd
- 707 Harvest Rd
- 606 Duchess Rd
- 706 Harvest Rd
Your Personal Tour Guide
Ask me questions while you tour the home.