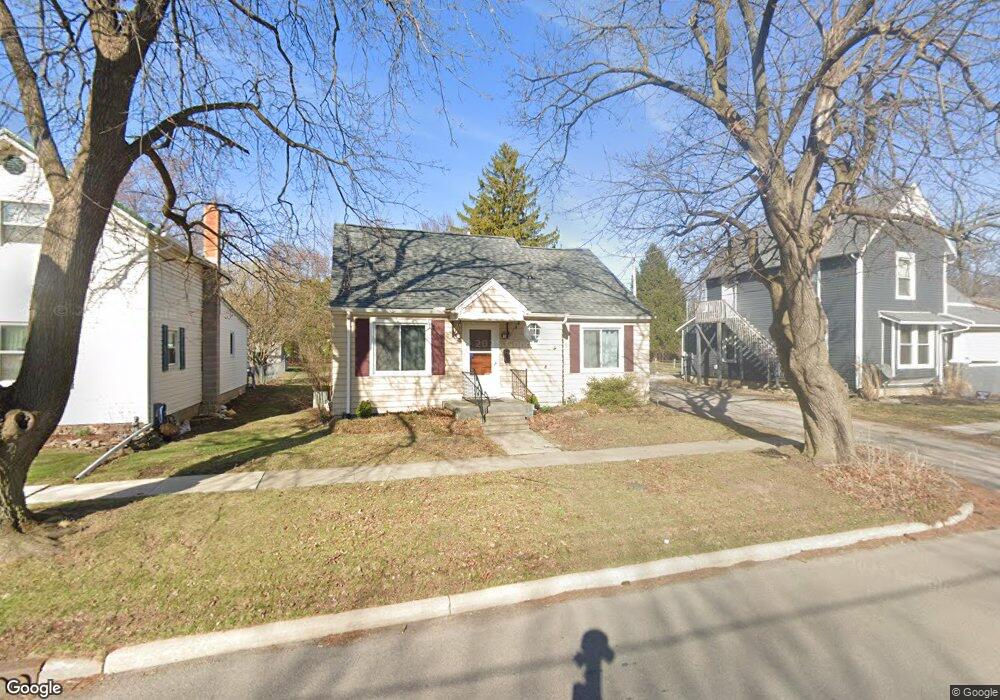
622 Hull Ave Findlay, OH 45840
Estimated Value: $143,273 - $175,000
2
Beds
2
Baths
962
Sq Ft
$167/Sq Ft
Est. Value
About This Home
This home is located at 622 Hull Ave, Findlay, OH 45840 and is currently estimated at $160,818, approximately $167 per square foot. 622 Hull Ave is a home located in Hancock County with nearby schools including Whittier Primary School, Bigelow Hill Elementary School, and Glenwood Middle School.
Ownership History
Date
Name
Owned For
Owner Type
Purchase Details
Closed on
Dec 14, 2006
Sold by
Blanchard Valley Industries Inc
Bought by
Zechman Casey N
Current Estimated Value
Home Financials for this Owner
Home Financials are based on the most recent Mortgage that was taken out on this home.
Original Mortgage
$101,802
Outstanding Balance
$60,730
Interest Rate
6.27%
Mortgage Type
FHA
Estimated Equity
$100,088
Purchase Details
Closed on
Nov 1, 2000
Sold by
Price Gregory A
Bought by
Blanchard Valley Ind Inc
Home Financials for this Owner
Home Financials are based on the most recent Mortgage that was taken out on this home.
Original Mortgage
$48,677
Interest Rate
7.96%
Mortgage Type
New Conventional
Purchase Details
Closed on
Aug 1, 1994
Sold by
Bacho Geoffrey
Bought by
Price Gregory and Price Julie
Home Financials for this Owner
Home Financials are based on the most recent Mortgage that was taken out on this home.
Original Mortgage
$49,500
Interest Rate
8.41%
Mortgage Type
New Conventional
Purchase Details
Closed on
Jun 7, 1993
Bought by
Bacho Geoffrey A
Purchase Details
Closed on
May 20, 1983
Bought by
Bacho John P and Bacho Wilma N
Create a Home Valuation Report for This Property
The Home Valuation Report is an in-depth analysis detailing your home's value as well as a comparison with similar homes in the area
Home Values in the Area
Average Home Value in this Area
Purchase History
| Date | Buyer | Sale Price | Title Company |
|---|---|---|---|
| Zechman Casey N | $103,400 | Southeast Equity | |
| Blanchard Valley Ind Inc | $92,000 | -- | |
| Price Gregory | $55,000 | -- | |
| Bacho Geoffrey A | -- | -- | |
| Bacho John P | $23,000 | -- |
Source: Public Records
Mortgage History
| Date | Status | Borrower | Loan Amount |
|---|---|---|---|
| Open | Zechman Casey N | $101,802 | |
| Previous Owner | Blanchard Valley Ind Inc | $48,677 | |
| Previous Owner | Price Gregory | $49,500 |
Source: Public Records
Tax History
| Year | Tax Paid | Tax Assessment Tax Assessment Total Assessment is a certain percentage of the fair market value that is determined by local assessors to be the total taxable value of land and additions on the property. | Land | Improvement |
|---|---|---|---|---|
| 2024 | $1,145 | $32,220 | $5,020 | $27,200 |
| 2023 | $1,146 | $32,220 | $5,020 | $27,200 |
| 2022 | $1,142 | $32,220 | $5,020 | $27,200 |
| 2021 | $1,036 | $25,460 | $5,280 | $20,180 |
| 2020 | $1,036 | $25,460 | $5,280 | $20,180 |
| 2019 | $1,015 | $25,460 | $5,280 | $20,180 |
| 2018 | $907 | $20,880 | $4,590 | $16,290 |
| 2017 | $454 | $20,880 | $4,590 | $16,290 |
| 2016 | $906 | $20,880 | $4,590 | $16,290 |
| 2015 | $853 | $19,500 | $2,380 | $17,120 |
| 2014 | $853 | $19,500 | $2,380 | $17,120 |
| 2012 | $860 | $19,500 | $2,380 | $17,120 |
Source: Public Records
Map
Nearby Homes
- 716 Winfield Ave
- 912 Parkside Place
- 1125 Glen Meadow Dr
- 1062 Vincent St
- 322 Midland Ave
- 1209 Heather Dr
- 1142 Concord Ct
- 439 Carnahan Ave
- 301 Allen Ave
- 204 Laquineo St
- 1216 Concord Ct
- 206 Midland Ave
- 640 Center St
- 1020 Country Club Dr
- 1308 Greendale Ave
- 1725 Parkside Place
- 0 Sheridan Ave
- 1820 Gayle Ln
- 1030 Sheridan Ave
- 523 Center St
Your Personal Tour Guide
Ask me questions while you tour the home.