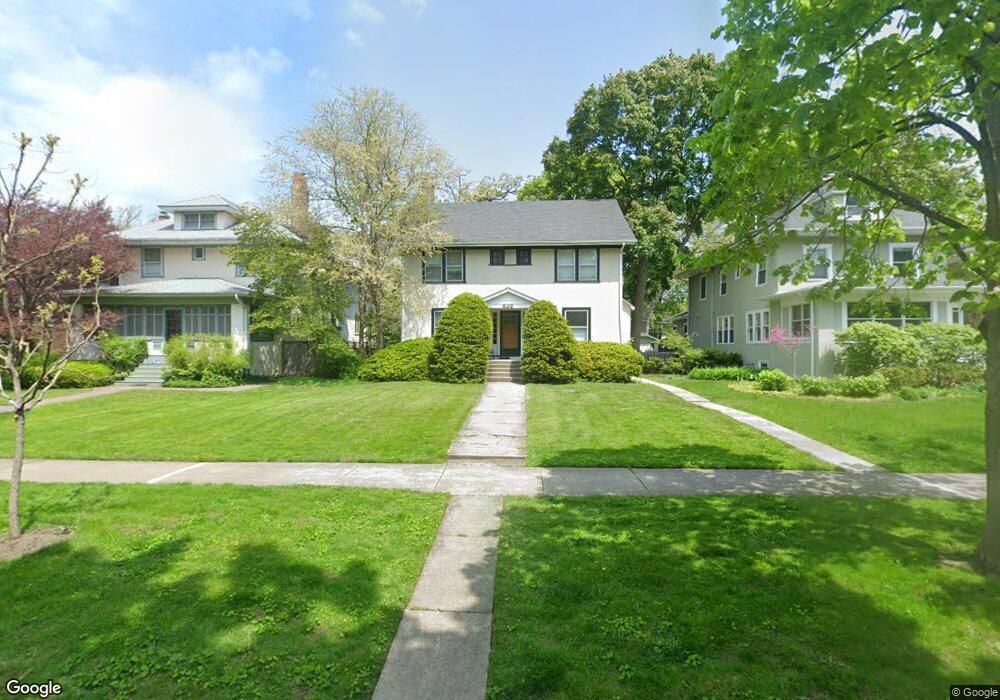
622 Maple Ave Wilmette, IL 60091
Estimated Value: $1,283,000 - $1,515,629
5
Beds
3
Baths
2,920
Sq Ft
$481/Sq Ft
Est. Value
About This Home
This home is located at 622 Maple Ave, Wilmette, IL 60091 and is currently estimated at $1,403,157, approximately $480 per square foot. 622 Maple Ave is a home located in Cook County with nearby schools including Central Elementary School, Highcrest Middle School, and Wilmette Junior High School.
Ownership History
Date
Name
Owned For
Owner Type
Purchase Details
Closed on
Oct 26, 2022
Sold by
Ellman Michael H and Ellman Roberta H
Bought by
Michael H Ellman Trust and Ellman
Current Estimated Value
Purchase Details
Closed on
Jul 2, 2010
Sold by
Ellman Carol F and Vassallo Brett J
Bought by
Ellman Michael H and Ellman Roberta H
Home Financials for this Owner
Home Financials are based on the most recent Mortgage that was taken out on this home.
Original Mortgage
$205,000
Interest Rate
4.25%
Mortgage Type
New Conventional
Purchase Details
Closed on
Jun 20, 2007
Sold by
Schachman David and Schachman Nancy L
Bought by
Ellman Carol and Vassallo Brett J
Home Financials for this Owner
Home Financials are based on the most recent Mortgage that was taken out on this home.
Original Mortgage
$745,600
Interest Rate
6.37%
Mortgage Type
Unknown
Create a Home Valuation Report for This Property
The Home Valuation Report is an in-depth analysis detailing your home's value as well as a comparison with similar homes in the area
Home Values in the Area
Average Home Value in this Area
Purchase History
| Date | Buyer | Sale Price | Title Company |
|---|---|---|---|
| Michael H Ellman Trust | -- | None Listed On Document | |
| Ellman Michael H | $600,000 | Cti | |
| Ellman Carol | $932,000 | Cti |
Source: Public Records
Mortgage History
| Date | Status | Borrower | Loan Amount |
|---|---|---|---|
| Previous Owner | Ellman Michael H | $205,000 | |
| Previous Owner | Ellman Carol | $745,600 |
Source: Public Records
Tax History
| Year | Tax Paid | Tax Assessment Tax Assessment Total Assessment is a certain percentage of the fair market value that is determined by local assessors to be the total taxable value of land and additions on the property. | Land | Improvement |
|---|---|---|---|---|
| 2025 | $23,380 | $133,000 | $29,250 | $103,750 |
| 2024 | $23,380 | $103,824 | $24,750 | $79,074 |
| 2023 | $22,088 | $109,000 | $24,750 | $84,250 |
| 2022 | $22,088 | $109,000 | $24,750 | $84,250 |
| 2021 | $16,760 | $70,506 | $19,800 | $50,706 |
| 2020 | $16,591 | $70,506 | $19,800 | $50,706 |
| 2019 | $16,074 | $76,637 | $19,800 | $56,837 |
| 2018 | $17,408 | $79,354 | $17,100 | $62,254 |
| 2017 | $18,971 | $88,085 | $17,100 | $70,985 |
| 2016 | $21,027 | $101,020 | $17,100 | $83,920 |
| 2015 | $19,655 | $83,671 | $14,175 | $69,496 |
| 2014 | $19,365 | $83,671 | $14,175 | $69,496 |
| 2013 | $18,469 | $83,671 | $14,175 | $69,496 |
Source: Public Records
Map
Nearby Homes
- 526 Linden Ave
- 414 Laurel Ave
- 420 Linden Ave Unit 502
- 526 8th St
- 512 Central Ave
- 2647 Poplar Ave
- 412 Central Ave
- 325 Central Ave
- 626 Washington Ave
- 309 Driftwood Ln
- 835 Forest Ave
- 2515 Prairie Ave Unit 1E
- 1209 Maple Ave
- 2505 Prairie Ave Unit 2K
- 2611 Walnut Ave
- 1813 Lincoln St
- 2508 Isabella St
- 611 Elmwood Ave
- 2500 Thayer St
- 2108 Harrison St
Your Personal Tour Guide
Ask me questions while you tour the home.