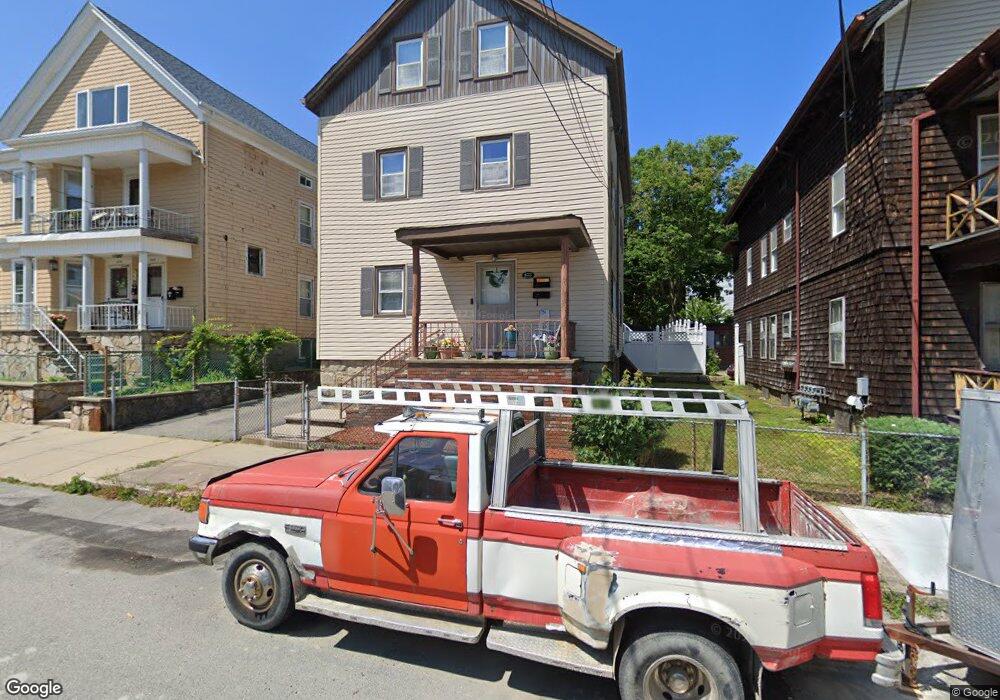
622 Maple St Fall River, MA 02720
Bank Street NeighborhoodEstimated Value: $455,000 - $605,000
5
Beds
3
Baths
2,737
Sq Ft
$189/Sq Ft
Est. Value
About This Home
This home is located at 622 Maple St, Fall River, MA 02720 and is currently estimated at $516,340, approximately $188 per square foot. 622 Maple St is a home located in Bristol County with nearby schools including Mary Fonseca Elementary School, Morton Middle School, and B M C Durfee High School.
Ownership History
Date
Name
Owned For
Owner Type
Purchase Details
Closed on
Jul 7, 2023
Sold by
Demelo Jose
Bought by
Dynasty T and Demelo
Current Estimated Value
Purchase Details
Closed on
Mar 6, 2015
Sold by
Soares Lizette D and Demelo Carlos
Bought by
Demelo Jose T
Home Financials for this Owner
Home Financials are based on the most recent Mortgage that was taken out on this home.
Original Mortgage
$180,000
Interest Rate
3.64%
Mortgage Type
New Conventional
Create a Home Valuation Report for This Property
The Home Valuation Report is an in-depth analysis detailing your home's value as well as a comparison with similar homes in the area
Home Values in the Area
Average Home Value in this Area
Purchase History
| Date | Buyer | Sale Price | Title Company |
|---|---|---|---|
| Dynasty T | -- | None Available | |
| Demelo Jose T | $200,000 | -- |
Source: Public Records
Mortgage History
| Date | Status | Borrower | Loan Amount |
|---|---|---|---|
| Previous Owner | Demelo Jose T | $180,000 |
Source: Public Records
Tax History
| Year | Tax Paid | Tax Assessment Tax Assessment Total Assessment is a certain percentage of the fair market value that is determined by local assessors to be the total taxable value of land and additions on the property. | Land | Improvement |
|---|---|---|---|---|
| 2025 | $5,174 | $451,900 | $115,700 | $336,200 |
| 2024 | $4,764 | $414,600 | $113,500 | $301,100 |
| 2023 | $4,455 | $363,100 | $102,200 | $260,900 |
| 2022 | $3,759 | $327,700 | $96,500 | $231,200 |
| 2021 | $3,759 | $271,800 | $92,100 | $179,700 |
| 2020 | $3,373 | $233,400 | $87,900 | $145,500 |
| 2019 | $3,318 | $227,600 | $91,900 | $135,700 |
| 2018 | $2,927 | $200,200 | $92,600 | $107,600 |
| 2017 | $2,730 | $195,000 | $92,600 | $102,400 |
| 2016 | $2,665 | $195,500 | $95,400 | $100,100 |
| 2015 | $2,564 | $196,000 | $95,400 | $100,600 |
| 2014 | $2,564 | $203,800 | $95,400 | $108,400 |
Source: Public Records
Map
Nearby Homes
- 612 Maple St
- 424 Linden St
- 642 Maple St
- 434 Linden St
- 434 Linden St Unit 6
- 434 Linden St Unit 5
- 434 Linden St Unit 4
- 434 Linden St Unit 3
- 434 Linden St Unit 1
- 357 Grove St
- 592 Maple St
- 613 Maple St
- 635 Maple St
- 627 Maple St
- 452 Linden St
- 627 1/2 Maple St
- 641 Maple St
- 369 Grove St
- 317 Grove St
- 380 Linden St
Your Personal Tour Guide
Ask me questions while you tour the home.