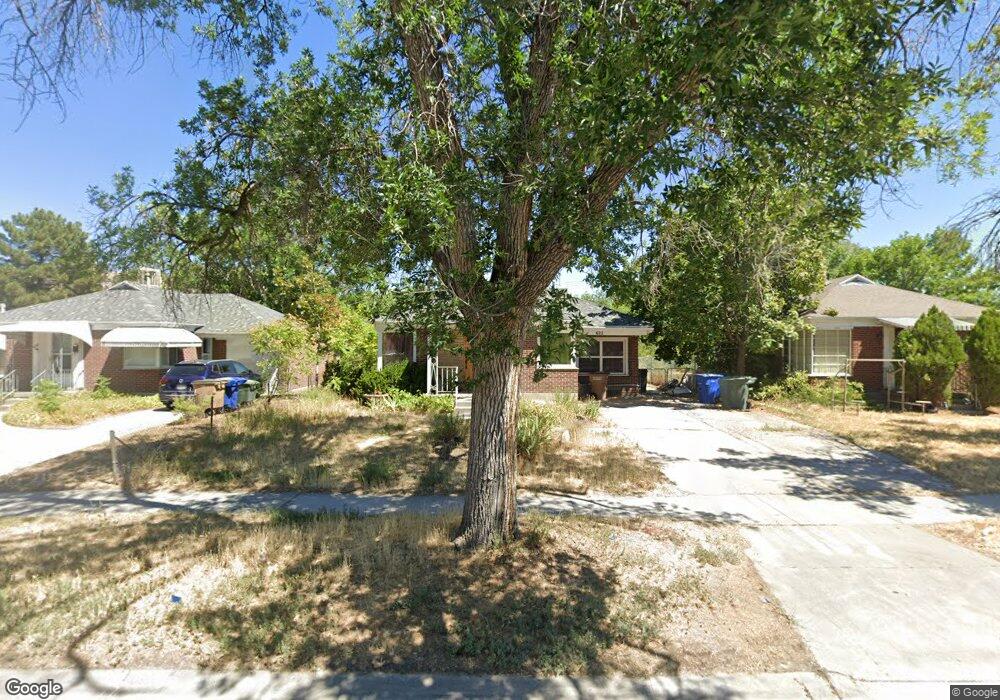
622 N 1300 W Salt Lake City, UT 84116
Rose Park NeighborhoodEstimated Value: $415,000 - $486,000
4
Beds
2
Baths
1,694
Sq Ft
$259/Sq Ft
Est. Value
About This Home
This home is located at 622 N 1300 W, Salt Lake City, UT 84116 and is currently estimated at $438,914, approximately $259 per square foot. 622 N 1300 W is a home located in Salt Lake County with nearby schools including Rose Park Elementary School, Northwest Middle School, and West High.
Ownership History
Date
Name
Owned For
Owner Type
Purchase Details
Closed on
Aug 25, 2014
Sold by
Wight Linda M
Bought by
Macis Wendy Nicole
Current Estimated Value
Home Financials for this Owner
Home Financials are based on the most recent Mortgage that was taken out on this home.
Original Mortgage
$196,128
Outstanding Balance
$149,547
Interest Rate
4.11%
Mortgage Type
VA
Estimated Equity
$289,367
Purchase Details
Closed on
Apr 2, 2013
Sold by
Devore Darwin and Devore Sandra
Bought by
Wight Linda M
Home Financials for this Owner
Home Financials are based on the most recent Mortgage that was taken out on this home.
Original Mortgage
$99,750
Interest Rate
3.54%
Mortgage Type
New Conventional
Purchase Details
Closed on
Oct 25, 2005
Sold by
Sweat Nola Jean
Bought by
Devore Darwin and Devore Sandra
Home Financials for this Owner
Home Financials are based on the most recent Mortgage that was taken out on this home.
Original Mortgage
$110,700
Interest Rate
5.68%
Mortgage Type
Purchase Money Mortgage
Create a Home Valuation Report for This Property
The Home Valuation Report is an in-depth analysis detailing your home's value as well as a comparison with similar homes in the area
Home Values in the Area
Average Home Value in this Area
Purchase History
| Date | Buyer | Sale Price | Title Company |
|---|---|---|---|
| Macis Wendy Nicole | -- | North American Title Llc | |
| Wight Linda M | -- | Investors Title Ins Agency | |
| Devore Darwin | -- | Meridian Title |
Source: Public Records
Mortgage History
| Date | Status | Borrower | Loan Amount |
|---|---|---|---|
| Open | Macis Wendy Nicole | $196,128 | |
| Previous Owner | Wight Linda M | $99,750 | |
| Previous Owner | Devore Darwin | $110,700 |
Source: Public Records
Tax History Compared to Growth
Tax History
| Year | Tax Paid | Tax Assessment Tax Assessment Total Assessment is a certain percentage of the fair market value that is determined by local assessors to be the total taxable value of land and additions on the property. | Land | Improvement |
|---|---|---|---|---|
| 2025 | -- | $431,000 | $131,000 | $300,000 |
| 2024 | -- | $402,600 | $124,000 | $278,600 |
| 2023 | $2,193 | $375,500 | $119,200 | $256,300 |
| 2022 | $2,193 | $378,400 | $116,900 | $261,500 |
| 2021 | $1,876 | $293,100 | $88,600 | $204,500 |
| 2020 | $1,783 | $265,200 | $79,100 | $186,100 |
| 2019 | $1,846 | $258,200 | $69,700 | $188,500 |
| 2018 | $1,511 | $205,900 | $69,700 | $136,200 |
| 2017 | $1,634 | $208,600 | $69,700 | $138,900 |
| 2016 | $1,536 | $186,200 | $58,600 | $127,600 |
| 2015 | $1,061 | $121,900 | $55,700 | $66,200 |
| 2014 | $1,010 | $115,100 | $54,500 | $60,600 |
Source: Public Records
Map
Nearby Homes
- 618 N Oakley St Unit B206
- 664 N Oakley St Unit E101
- 557 N 1300 W
- 669 N Colorado St
- 557 N 1200 W
- 1150 W Girard Ave
- 814 N 1400 W
- 1140 W Ouray Ave
- 1067 W Signora Dr
- 385 N 1200 W
- 876 N 1300 W
- 1031 N Rambler Dr
- 705 American Beauty Dr
- 565 N 1200 W
- 736 N American Beauty Dr
- 1157 Simondi Ave
- 715 N Pearl Harbor St
- 1026 W 800 N
- 1059 W 400 N
- 506 N 1000 W