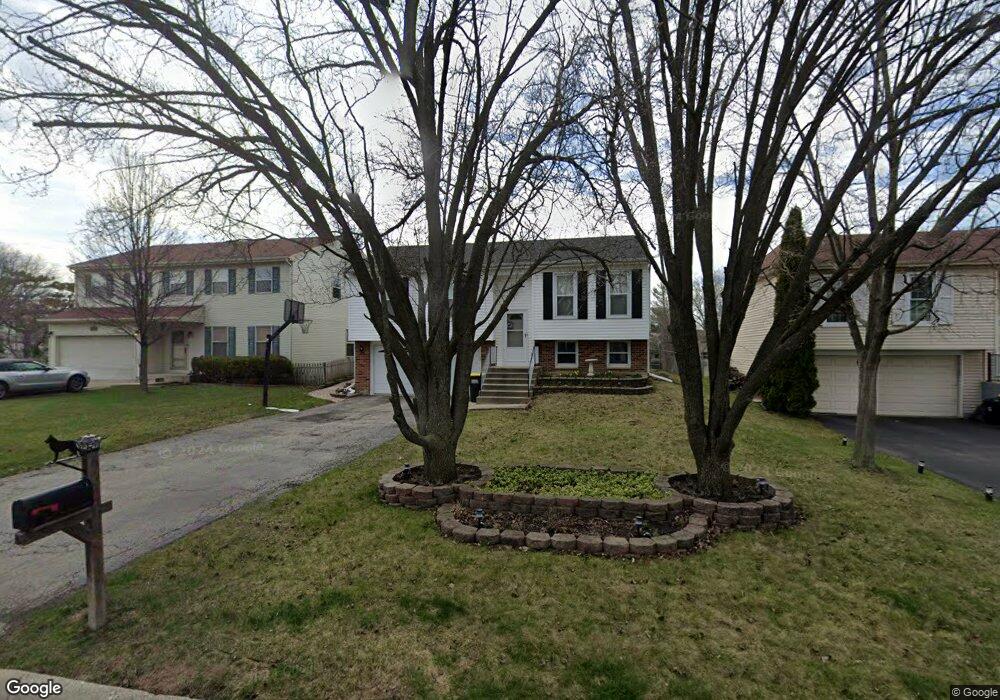
622 Oswego Dr Carol Stream, IL 60188
Estimated Value: $357,764 - $387,000
4
Beds
2
Baths
2,102
Sq Ft
$176/Sq Ft
Est. Value
About This Home
This home is located at 622 Oswego Dr, Carol Stream, IL 60188 and is currently estimated at $370,441, approximately $176 per square foot. 622 Oswego Dr is a home located in DuPage County with nearby schools including Evergreen Elementary School, Benjamin Middle School, and West Chicago Community High School.
Ownership History
Date
Name
Owned For
Owner Type
Purchase Details
Closed on
Jul 30, 2004
Sold by
Blomquist Christopher and Blomquist Karin
Bought by
Johnson Robert M and Johnson Laura M
Current Estimated Value
Home Financials for this Owner
Home Financials are based on the most recent Mortgage that was taken out on this home.
Original Mortgage
$179,000
Outstanding Balance
$89,353
Interest Rate
6.1%
Mortgage Type
Purchase Money Mortgage
Estimated Equity
$281,088
Purchase Details
Closed on
Jul 17, 2002
Sold by
Tracey Brian P and Tracey Karen W
Bought by
Blomquist Christopher M and Blomquist Karin L
Home Financials for this Owner
Home Financials are based on the most recent Mortgage that was taken out on this home.
Original Mortgage
$181,900
Interest Rate
6.8%
Mortgage Type
Balloon
Create a Home Valuation Report for This Property
The Home Valuation Report is an in-depth analysis detailing your home's value as well as a comparison with similar homes in the area
Home Values in the Area
Average Home Value in this Area
Purchase History
| Date | Buyer | Sale Price | Title Company |
|---|---|---|---|
| Johnson Robert M | $235,000 | Metropolitan Title Co | |
| Blomquist Christopher M | $196,000 | -- |
Source: Public Records
Mortgage History
| Date | Status | Borrower | Loan Amount |
|---|---|---|---|
| Open | Johnson Robert M | $179,000 | |
| Previous Owner | Blomquist Christopher M | $181,900 |
Source: Public Records
Tax History
| Year | Tax Paid | Tax Assessment Tax Assessment Total Assessment is a certain percentage of the fair market value that is determined by local assessors to be the total taxable value of land and additions on the property. | Land | Improvement |
|---|---|---|---|---|
| 2024 | $7,195 | $99,650 | $34,212 | $65,438 |
| 2023 | $7,548 | $90,410 | $31,040 | $59,370 |
| 2022 | $7,206 | $84,030 | $28,850 | $55,180 |
| 2021 | $6,888 | $79,770 | $27,390 | $52,380 |
| 2020 | $6,710 | $77,380 | $26,570 | $50,810 |
| 2019 | $6,541 | $74,620 | $25,620 | $49,000 |
| 2018 | $6,081 | $70,360 | $24,160 | $46,200 |
| 2017 | $5,963 | $67,560 | $23,200 | $44,360 |
| 2016 | $5,839 | $64,530 | $22,160 | $42,370 |
| 2015 | $5,771 | $61,090 | $20,980 | $40,110 |
| 2014 | $5,542 | $57,680 | $20,450 | $37,230 |
| 2013 | $5,437 | $59,060 | $20,940 | $38,120 |
Source: Public Records
Map
Nearby Homes
- 576 Iroquois Trail
- 848 Birchbark Trail
- 27W270 Jefferson St
- 3N010 Woodview Dr
- 27W046 North Ave
- 522 Apache Ln
- 552 Cochise Place
- 1304 Yorkshire Ln
- 403 Arrowhead Trail
- 426 Thunderbird Trail
- 352 Sioux Ln
- 792 Trinity Ct
- 992 Navajo St
- 670 Leslie Ct
- 1430 Preserve Dr Unit 29
- 1N053 Lot 1 Farwell St
- 1N063 LOT 2 Farwell St
- 1N083 LOT 4 Farwell St
- 1043 Quarry Ct Unit 11
- 1048 Quarry Ct Unit 13