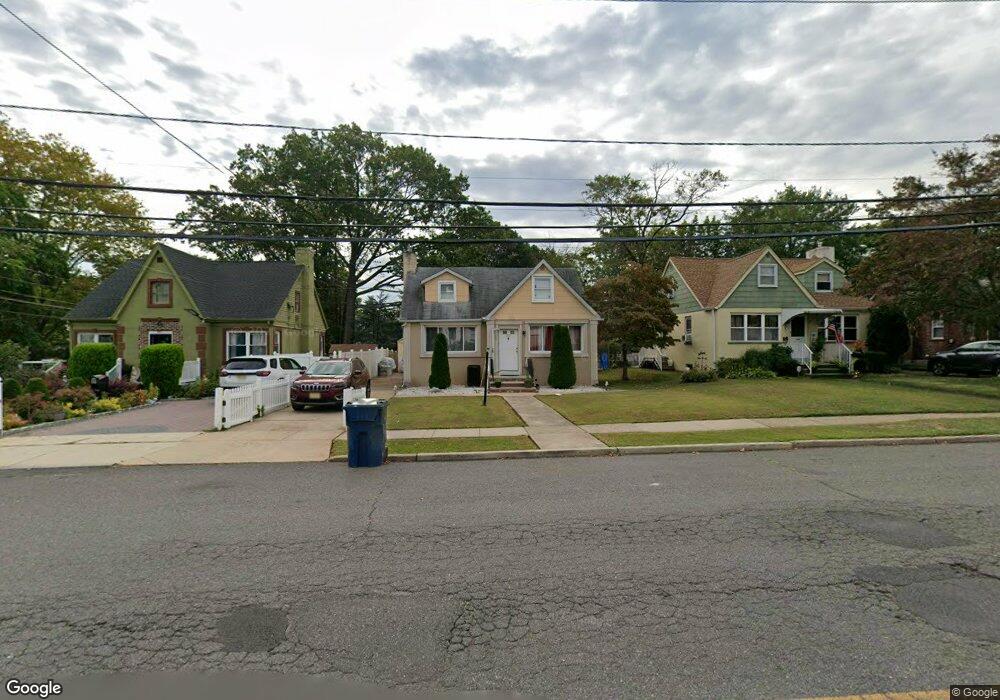
622 Remsen Ave North Brunswick, NJ 08902
Estimated Value: $461,000 - $563,000
4
Beds
3
Baths
1,226
Sq Ft
$403/Sq Ft
Est. Value
About This Home
This home is located at 622 Remsen Ave, North Brunswick, NJ 08902 and is currently estimated at $494,627, approximately $403 per square foot. 622 Remsen Ave is a home located in Middlesex County with nearby schools including Parsons Elementary School, Linwood Middle School, and North Brunswick Twp High School.
Ownership History
Date
Name
Owned For
Owner Type
Purchase Details
Closed on
May 30, 2017
Sold by
Wells Fargo Bank N A
Bought by
Habashy Maged
Current Estimated Value
Purchase Details
Closed on
Jan 26, 2017
Sold by
Mehalick Janet and Mehalick Allen
Bought by
Wells Fargo Bank Na
Purchase Details
Closed on
Sep 7, 2010
Sold by
Dekanski Joseph
Bought by
Mehalick Allen and Mehalick Janet
Home Financials for this Owner
Home Financials are based on the most recent Mortgage that was taken out on this home.
Original Mortgage
$225,461
Interest Rate
4.75%
Mortgage Type
FHA
Purchase Details
Closed on
Aug 26, 2009
Sold by
Ostella Frank M and Ostella Lisa M
Bought by
Dekanski Joseph
Purchase Details
Closed on
Aug 6, 1999
Sold by
Demato Joseph
Bought by
Ostella Frank and Ostella Lisa
Home Financials for this Owner
Home Financials are based on the most recent Mortgage that was taken out on this home.
Original Mortgage
$151,650
Interest Rate
7.5%
Mortgage Type
FHA
Create a Home Valuation Report for This Property
The Home Valuation Report is an in-depth analysis detailing your home's value as well as a comparison with similar homes in the area
Home Values in the Area
Average Home Value in this Area
Purchase History
| Date | Buyer | Sale Price | Title Company |
|---|---|---|---|
| Habashy Maged | $167,500 | East Coast Title Agency | |
| Wells Fargo Bank Na | -- | None Available | |
| Mehalick Allen | $245,000 | Manchester Title Agency Inc | |
| Dekanski Joseph | $140,000 | None Available | |
| Ostella Frank | $152,900 | -- |
Source: Public Records
Mortgage History
| Date | Status | Borrower | Loan Amount |
|---|---|---|---|
| Previous Owner | Mehalick Allen | $225,461 | |
| Previous Owner | Ostella Frank | $151,650 |
Source: Public Records
Tax History Compared to Growth
Tax History
| Year | Tax Paid | Tax Assessment Tax Assessment Total Assessment is a certain percentage of the fair market value that is determined by local assessors to be the total taxable value of land and additions on the property. | Land | Improvement |
|---|---|---|---|---|
| 2025 | $7,267 | $114,700 | $51,300 | $63,400 |
| 2024 | $7,137 | $114,700 | $51,300 | $63,400 |
| 2023 | $7,137 | $114,700 | $51,300 | $63,400 |
| 2022 | $6,893 | $114,700 | $51,300 | $63,400 |
| 2021 | $6,716 | $114,700 | $51,300 | $63,400 |
| 2020 | $6,637 | $114,700 | $51,300 | $63,400 |
| 2019 | $6,501 | $114,700 | $51,300 | $63,400 |
| 2018 | $6,368 | $114,700 | $51,300 | $63,400 |
| 2017 | $6,256 | $114,700 | $51,300 | $63,400 |
| 2016 | $6,125 | $114,700 | $51,300 | $63,400 |
| 2015 | $6,021 | $114,700 | $51,300 | $63,400 |
| 2014 | $5,953 | $114,700 | $51,300 | $63,400 |
Source: Public Records
Map
Nearby Homes
- 38 Cleremont Ave
- 803 Nassau St
- 640 Livingston Ave
- 7 Oakwood Place
- 16 6th St
- 19 7th St
- 855 Newton St
- 76 May St
- 147 Rutgers St
- 966 Bergen Ave
- 929 Hermann Rd
- 201 Fulton St
- 790 Cranbury Cross Rd
- 25 Rutgers St
- 122 Lawrence St Unit 26
- 4 N Ward St
- 75 Georges Rd
- 37 Hazelhurst St
- 82 S Ward St
- 18 N Talmadge St
- 624 Remsen Ave
- 620 Remsen Ave
- 626 Remsen Ave
- 880 Hollywood St
- 614 Remsen Ave
- 628 Remsen Ave
- 619 Remsen Ave
- 617 Remsen Ave
- 106 Hollywood St
- 7 Stevens St
- 875 Hollywood St Unit 885
- 9 Stevens St
- 621 Remsen Ave
- 627 Remsen Ave
- 607 Remsen Ave
- 108 Hollywood St
- 605 Remsen Ave
- 105 Stevens St
- 882 Nassau St
- 865 Hollywood St