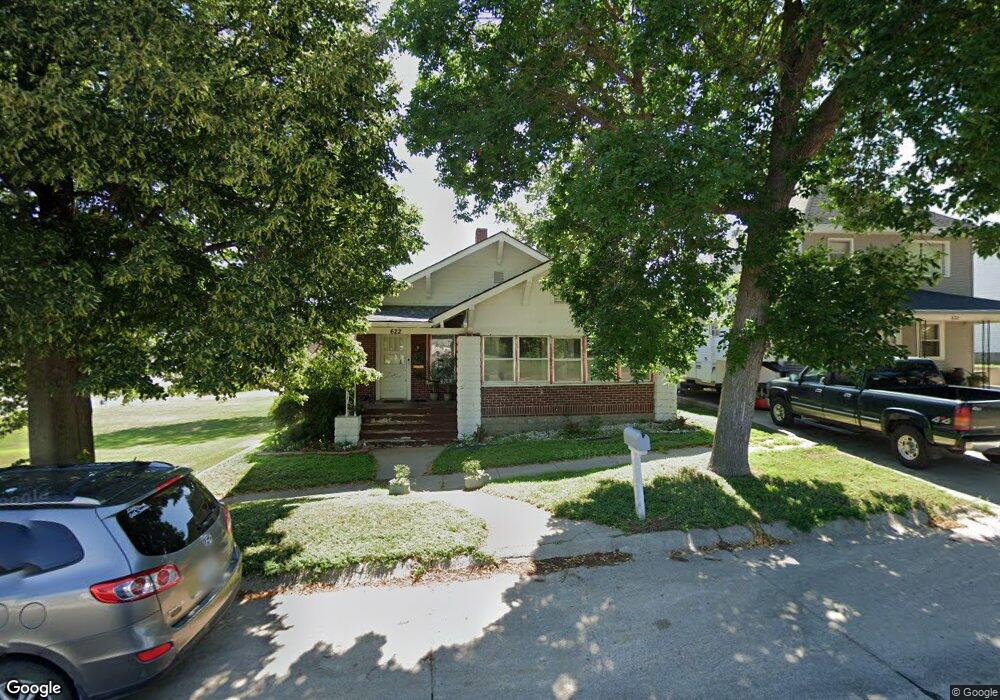
622 S 9th Ave Broken Bow, NE 68822
Estimated Value: $130,000 - $181,035
--
Bed
1
Bath
1,276
Sq Ft
$122/Sq Ft
Est. Value
About This Home
This home is located at 622 S 9th Ave, Broken Bow, NE 68822 and is currently estimated at $156,259, approximately $122 per square foot. 622 S 9th Ave is a home located in Custer County with nearby schools including North Park Elementary School, Broken Bow Junior High School, and Broken Bow High School.
Ownership History
Date
Name
Owned For
Owner Type
Purchase Details
Closed on
Feb 26, 2014
Sold by
First National Bank In Ord
Bought by
Ams Rentals Llc
Current Estimated Value
Purchase Details
Closed on
Jan 23, 2014
Sold by
Glidden Tiffany A
Bought by
First National Bank In Ord
Purchase Details
Closed on
Jun 30, 2008
Sold by
Deutsche Bank Nat Tr Co
Bought by
Glidden Tiffany A
Purchase Details
Closed on
Jan 22, 2008
Sold by
Sleicher Mark R and Sleicher Monica D
Bought by
Deutsche Bank Nat Tr Co
Purchase Details
Closed on
Aug 5, 2005
Sold by
Wright Stacy Ann
Bought by
Sleicher Mark R and Sleicher Monica D
Create a Home Valuation Report for This Property
The Home Valuation Report is an in-depth analysis detailing your home's value as well as a comparison with similar homes in the area
Home Values in the Area
Average Home Value in this Area
Purchase History
| Date | Buyer | Sale Price | Title Company |
|---|---|---|---|
| Ams Rentals Llc | $30,000 | -- | |
| First National Bank In Ord | $30,000 | -- | |
| Glidden Tiffany A | $37,500 | -- | |
| Deutsche Bank Nat Tr Co | -- | -- | |
| Sleicher Mark R | $67,000 | -- |
Source: Public Records
Tax History Compared to Growth
Tax History
| Year | Tax Paid | Tax Assessment Tax Assessment Total Assessment is a certain percentage of the fair market value that is determined by local assessors to be the total taxable value of land and additions on the property. | Land | Improvement |
|---|---|---|---|---|
| 2025 | $2,035 | $177,661 | $5,544 | $172,117 |
| 2024 | $2,035 | $149,843 | $5,544 | $144,299 |
| 2023 | $2,247 | $143,475 | $5,544 | $137,931 |
| 2022 | $2,242 | $122,186 | $5,544 | $116,642 |
| 2021 | $2,183 | $121,682 | $5,040 | $116,642 |
| 2020 | $1,037 | $58,332 | $5,040 | $53,292 |
| 2019 | $1,320 | $74,373 | $3,781 | $70,592 |
| 2017 | $1,197 | $65,562 | $3,781 | $61,781 |
| 2016 | $1,284 | $64,251 | $2,470 | $61,781 |
| 2015 | $1,263 | $62,648 | $2,437 | $60,211 |
| 2014 | $1,263 | $56,952 | $2,215 | $54,737 |
Source: Public Records
Map
Nearby Homes