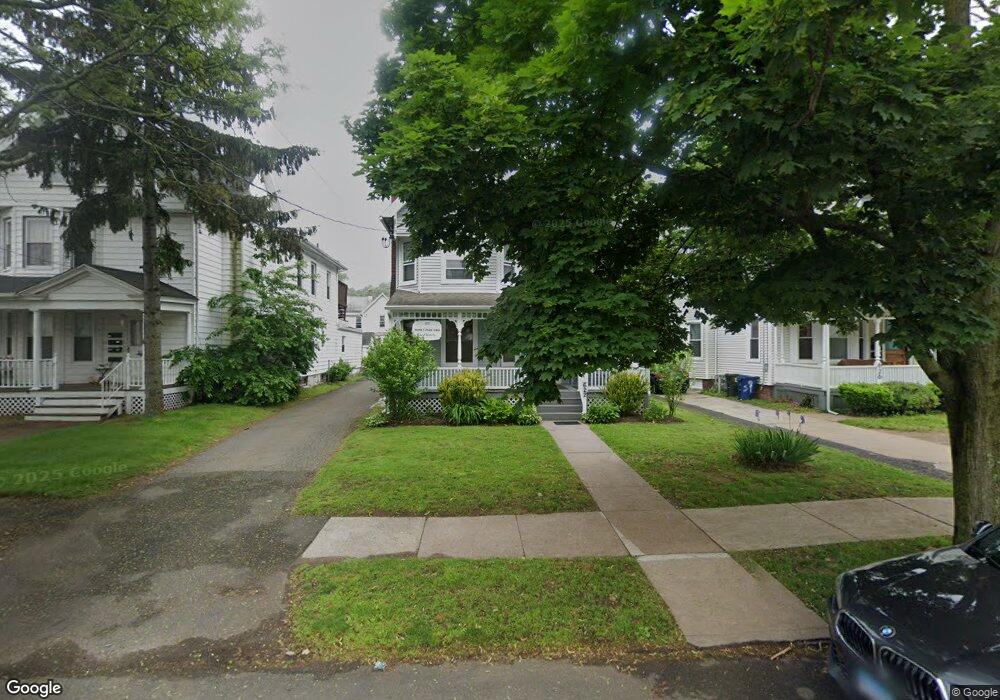
622 Savin Ave West Haven, CT 06516
West Haven Center NeighborhoodEstimated Value: $686,237
2
Beds
2
Baths
2,194
Sq Ft
$313/Sq Ft
Est. Value
About This Home
This home is located at 622 Savin Ave, West Haven, CT 06516 and is currently estimated at $686,237, approximately $312 per square foot. 622 Savin Ave is a home located in New Haven County with nearby schools including Carrigan 5/6 Intermediate School, Harry M. Bailey Middle School, and West Haven High School.
Ownership History
Date
Name
Owned For
Owner Type
Purchase Details
Closed on
Dec 4, 2000
Sold by
Allenir Inv Corp
Bought by
Ryan Mark T
Current Estimated Value
Home Financials for this Owner
Home Financials are based on the most recent Mortgage that was taken out on this home.
Original Mortgage
$204,000
Outstanding Balance
$75,501
Interest Rate
7.76%
Mortgage Type
Commercial
Estimated Equity
$610,736
Purchase Details
Closed on
Jul 20, 1999
Sold by
Rinella Jennifer A
Bought by
Allenir Inv Corp
Purchase Details
Closed on
Jun 3, 1993
Sold by
Willis Elinor K
Bought by
Rinella Jennifer A
Home Financials for this Owner
Home Financials are based on the most recent Mortgage that was taken out on this home.
Original Mortgage
$90,000
Interest Rate
5.5%
Mortgage Type
Commercial
Create a Home Valuation Report for This Property
The Home Valuation Report is an in-depth analysis detailing your home's value as well as a comparison with similar homes in the area
Home Values in the Area
Average Home Value in this Area
Purchase History
| Date | Buyer | Sale Price | Title Company |
|---|---|---|---|
| Ryan Mark T | $250,000 | -- | |
| Ryan Mark T | $250,000 | -- | |
| Allenir Inv Corp | $108,000 | -- | |
| Allenir Inv Corp | $108,000 | -- | |
| Rinella Jennifer A | $115,000 | -- | |
| Rinella Jennifer A | $115,000 | -- |
Source: Public Records
Mortgage History
| Date | Status | Borrower | Loan Amount |
|---|---|---|---|
| Open | Rinella Jennifer A | $204,000 | |
| Closed | Rinella Jennifer A | $204,000 | |
| Previous Owner | Rinella Jennifer A | $90,000 |
Source: Public Records
Tax History Compared to Growth
Tax History
| Year | Tax Paid | Tax Assessment Tax Assessment Total Assessment is a certain percentage of the fair market value that is determined by local assessors to be the total taxable value of land and additions on the property. | Land | Improvement |
|---|---|---|---|---|
| 2025 | $6,043 | $175,000 | $61,880 | $113,120 |
| 2024 | $6,378 | $131,460 | $42,840 | $88,620 |
| 2023 | $6,114 | $131,460 | $42,840 | $88,620 |
| 2022 | $5,995 | $131,460 | $42,840 | $88,620 |
| 2021 | $4,086 | $131,460 | $42,840 | $88,620 |
| 2020 | $4,086 | $118,580 | $34,650 | $83,930 |
| 2019 | $5,771 | $118,580 | $34,650 | $83,930 |
| 2018 | $7,566 | $118,580 | $34,650 | $83,930 |
| 2017 | $7,408 | $118,580 | $34,650 | $83,930 |
| 2016 | $5,403 | $118,580 | $34,650 | $83,930 |
| 2015 | $5,858 | $145,180 | $37,870 | $107,310 |
| 2014 | $5,822 | $145,180 | $37,870 | $107,310 |
Source: Public Records
Map
Nearby Homes