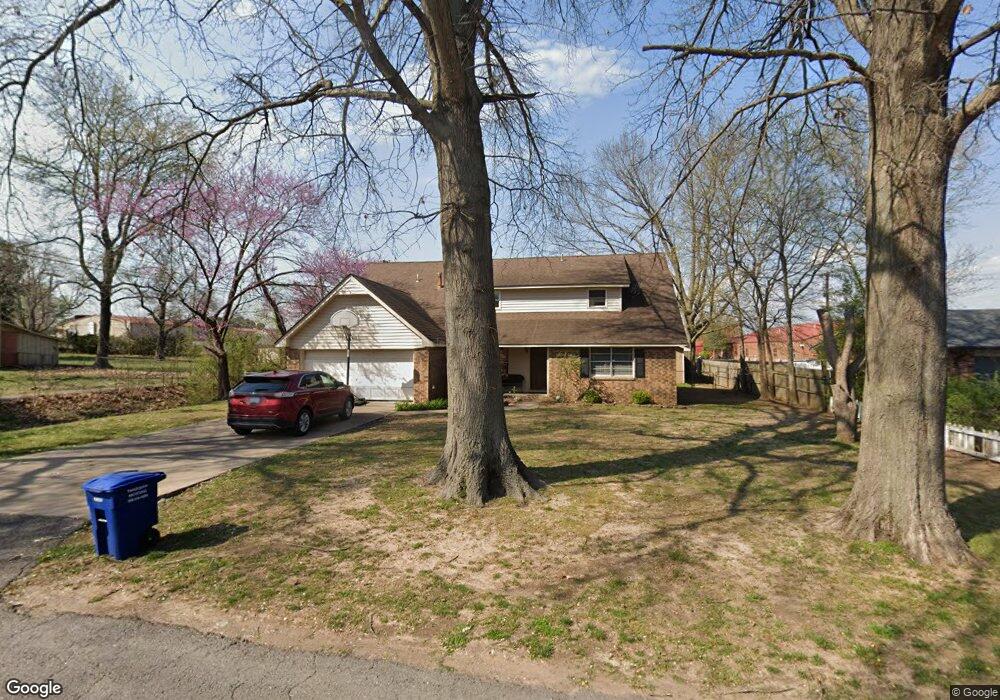
622 W Downing St Tahlequah, OK 74464
Estimated Value: $225,010 - $343,000
4
Beds
2
Baths
2,578
Sq Ft
$106/Sq Ft
Est. Value
About This Home
This home is located at 622 W Downing St, Tahlequah, OK 74464 and is currently estimated at $274,253, approximately $106 per square foot. 622 W Downing St is a home located in Cherokee County with nearby schools including Cherokee Elementary School, Greenwood Elementary School, and Tahlequah Middle School.
Ownership History
Date
Name
Owned For
Owner Type
Purchase Details
Closed on
Jun 23, 2006
Sold by
Yidi Edgar A and Yidi Edgar Anthony
Bought by
Hammons Andre D
Current Estimated Value
Home Financials for this Owner
Home Financials are based on the most recent Mortgage that was taken out on this home.
Original Mortgage
$135,850
Outstanding Balance
$79,824
Interest Rate
6.56%
Mortgage Type
New Conventional
Estimated Equity
$194,429
Purchase Details
Closed on
Oct 18, 2002
Sold by
Ron and Ellen Henderson
Bought by
Edgar and Wendy Yidi
Purchase Details
Closed on
Mar 27, 2001
Sold by
David'S Construction, Inc
Bought by
Ron and Ellen Henderson
Purchase Details
Closed on
Oct 12, 2000
Sold by
Carolyn Zoe Williams
Bought by
David'S Construction Inc
Purchase Details
Closed on
Aug 8, 1997
Sold by
Finch
Bought by
Williams
Create a Home Valuation Report for This Property
The Home Valuation Report is an in-depth analysis detailing your home's value as well as a comparison with similar homes in the area
Home Values in the Area
Average Home Value in this Area
Purchase History
| Date | Buyer | Sale Price | Title Company |
|---|---|---|---|
| Hammons Andre D | $143,000 | Heritage Title | |
| Edgar | $140,000 | -- | |
| Ron | $134,000 | -- | |
| David'S Construction Inc | $105,000 | -- | |
| Carolyn Zoe Williams | -- | -- | |
| Williams | $105,000 | -- |
Source: Public Records
Mortgage History
| Date | Status | Borrower | Loan Amount |
|---|---|---|---|
| Open | Hammons Andre D | $135,850 |
Source: Public Records
Tax History Compared to Growth
Tax History
| Year | Tax Paid | Tax Assessment Tax Assessment Total Assessment is a certain percentage of the fair market value that is determined by local assessors to be the total taxable value of land and additions on the property. | Land | Improvement |
|---|---|---|---|---|
| 2025 | $1,675 | $17,232 | $1,354 | $15,878 |
| 2024 | $1,675 | $17,682 | $1,354 | $16,328 |
| 2023 | $1,675 | $18,782 | $1,349 | $17,433 |
| 2022 | $1,743 | $18,782 | $1,349 | $17,433 |
| 2021 | $1,749 | $18,782 | $1,349 | $17,433 |
| 2020 | $1,781 | $18,782 | $1,349 | $17,433 |
| 2019 | $1,765 | $18,782 | $1,349 | $17,433 |
| 2018 | $1,818 | $19,120 | $1,349 | $17,771 |
| 2017 | $1,728 | $18,210 | $1,349 | $16,861 |
| 2016 | $1,656 | $17,342 | $1,349 | $15,993 |
| 2015 | $1,481 | $16,516 | $1,349 | $15,167 |
| 2014 | $1,481 | $15,730 | $1,349 | $14,381 |
Source: Public Records
Map
Nearby Homes
- 104 S West Ave
- 610 W Delaware St
- 807 W Choctaw St
- 0 W Choctaw St
- 515 W Delaware St
- 615 Russell Ave
- 702 N Jones Ave
- 321 W Shawnee St
- 916 Coy Ave
- 402 Minor St
- 310 York St
- 224 W Chickasaw St
- 1108 N Jones Ave
- 516 W Fox St
- 513 S State Ave
- 510 S Cherokee Ave
- 1025 W Fox St
- 2020 N Everly Dr
- 2021 N Everly Dr
- 2000 N Everly Dr
- 611 W Downing St
- 615 W Downing St
- 617 W Downing St
- 621 W Downing St
- 800 W Downing St
- 618 W Downing St
- 616 W Downing St
- 801 W Downing St
- 614 W Downing St
- 612 W Downing St
- 610 W Downing St
- 802 W Downing St
- 803 W Downing St
- 807 W Downing St
- 804 W Downing St
- 738 W Delaware St
- 717 W Shawnee St
- 737 W Shawnee St
- 711 W Shawnee St
- 809 W Downing St