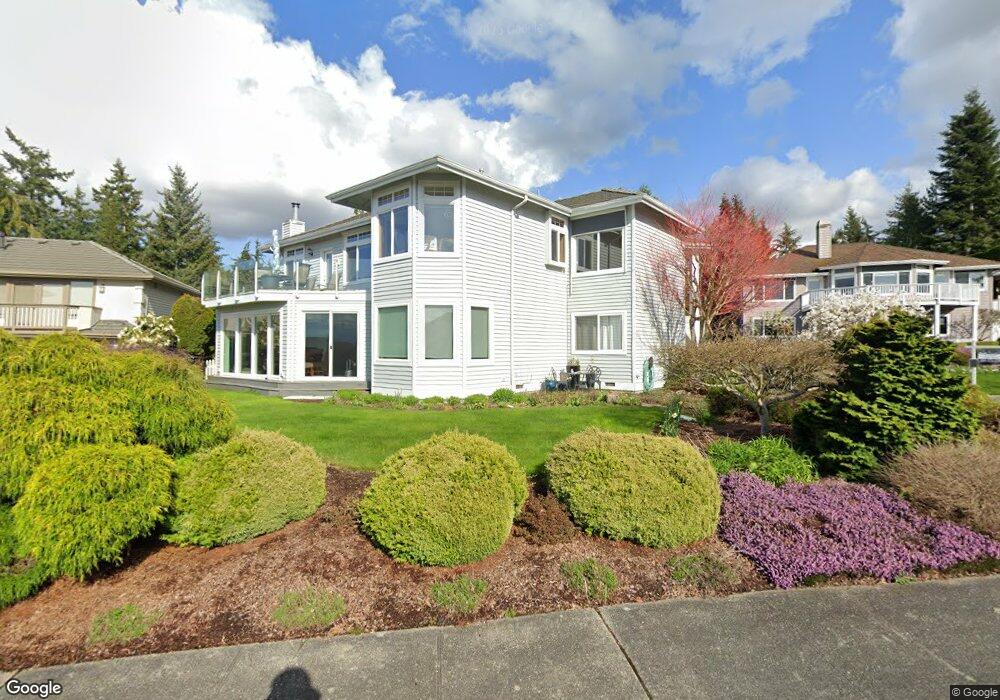
6221 138th Place SW Edmonds, WA 98026
Estimated Value: $1,250,562 - $1,609,000
3
Beds
3
Baths
2,025
Sq Ft
$701/Sq Ft
Est. Value
About This Home
This home is located at 6221 138th Place SW, Edmonds, WA 98026 and is currently estimated at $1,420,391, approximately $701 per square foot. 6221 138th Place SW is a home located in Snohomish County with nearby schools including Picnic Point Elementary School, Harbour Pointe Middle School, and Kamiak High School.
Ownership History
Date
Name
Owned For
Owner Type
Purchase Details
Closed on
Jan 24, 2003
Sold by
Pedersen Teresa R Hill and Hill Teresa R
Bought by
Pedersen Douglas C and Pedersen Teresa R Hill
Current Estimated Value
Home Financials for this Owner
Home Financials are based on the most recent Mortgage that was taken out on this home.
Original Mortgage
$235,000
Outstanding Balance
$100,791
Interest Rate
5.97%
Estimated Equity
$1,319,600
Purchase Details
Closed on
Sep 29, 1999
Sold by
Hansson Bertil M and Hansson Britt Marie
Bought by
Hill Teresa R
Home Financials for this Owner
Home Financials are based on the most recent Mortgage that was taken out on this home.
Original Mortgage
$240,000
Interest Rate
6.12%
Purchase Details
Closed on
Oct 27, 1993
Sold by
Emerald Pacific Homes Inc
Bought by
Hansson Bertil M and Hansson Britt Marie
Home Financials for this Owner
Home Financials are based on the most recent Mortgage that was taken out on this home.
Original Mortgage
$200,000
Interest Rate
6.95%
Create a Home Valuation Report for This Property
The Home Valuation Report is an in-depth analysis detailing your home's value as well as a comparison with similar homes in the area
Home Values in the Area
Average Home Value in this Area
Purchase History
| Date | Buyer | Sale Price | Title Company |
|---|---|---|---|
| Pedersen Douglas C | $16,853 | Stewart Title Company | |
| Hill Teresa R | $450,000 | Fidelity National Title Co | |
| Hansson Bertil M | $338,662 | Stewart Title Company |
Source: Public Records
Mortgage History
| Date | Status | Borrower | Loan Amount |
|---|---|---|---|
| Open | Pedersen Douglas C | $235,000 | |
| Closed | Hill Teresa R | $240,000 | |
| Previous Owner | Hansson Bertil M | $200,000 |
Source: Public Records
Tax History Compared to Growth
Tax History
| Year | Tax Paid | Tax Assessment Tax Assessment Total Assessment is a certain percentage of the fair market value that is determined by local assessors to be the total taxable value of land and additions on the property. | Land | Improvement |
|---|---|---|---|---|
| 2025 | $9,387 | $1,245,200 | $695,500 | $549,700 |
| 2024 | $9,387 | $1,123,500 | $600,000 | $523,500 |
| 2023 | $10,704 | $1,343,100 | $738,100 | $605,000 |
| 2022 | $9,210 | $976,500 | $452,200 | $524,300 |
| 2020 | $7,783 | $799,900 | $388,800 | $411,100 |
| 2019 | $7,524 | $776,900 | $391,300 | $385,600 |
| 2018 | $7,576 | $682,100 | $332,800 | $349,300 |
| 2017 | $7,080 | $653,200 | $329,400 | $323,800 |
| 2016 | $6,348 | $581,400 | $275,000 | $306,400 |
| 2015 | $6,535 | $548,400 | $280,000 | $268,400 |
| 2013 | $5,462 | $429,100 | $225,000 | $204,100 |
Source: Public Records
Map
Nearby Homes
- 13802 60th Ave W
- 6306 141st St SW
- 6420 141st St SW
- 6122 144th St SW
- 13813 68th Ave W
- 6625 136th Place SW
- 6520 146th St SW
- 6519 148th Place SW
- 14019 52nd Ave W Unit B
- 5119 136th St SW
- 14714 53rd Ave W Unit 116
- 14714 53rd Ave W Unit 119
- 6509 128th Place SW
- 6523 128th Place SW
- 5015 144th St SW Unit B1
- 5015 144th St SW Unit A4
- 5015 144th St SW Unit B3
- 5015 144th St SW Unit C1
- 14224 Beverly Park Rd Unit A
- 4726 Picnic Point Rd
- 13815 63rd Place W
- 6229 138th Place SW
- 6126 139th Place SW
- 6120 139th Place SW
- 6127 139th Place SW
- 6213 138th Place SW
- 6224 138th Place SW
- 13811 63rd Place W
- 6230 138th Place SW
- 6220 138th Place SW
- 6212 138th Place SW
- 6131 140th St SW
- 6216 138th Place SW
- 6112 139th Place SW
- 6123 139th Place SW
- 13818 63rd Place W
- 6302 138th Place SW
- 6123 140th St SW
- 13810 63rd Place W
- 13814 63rd Place W