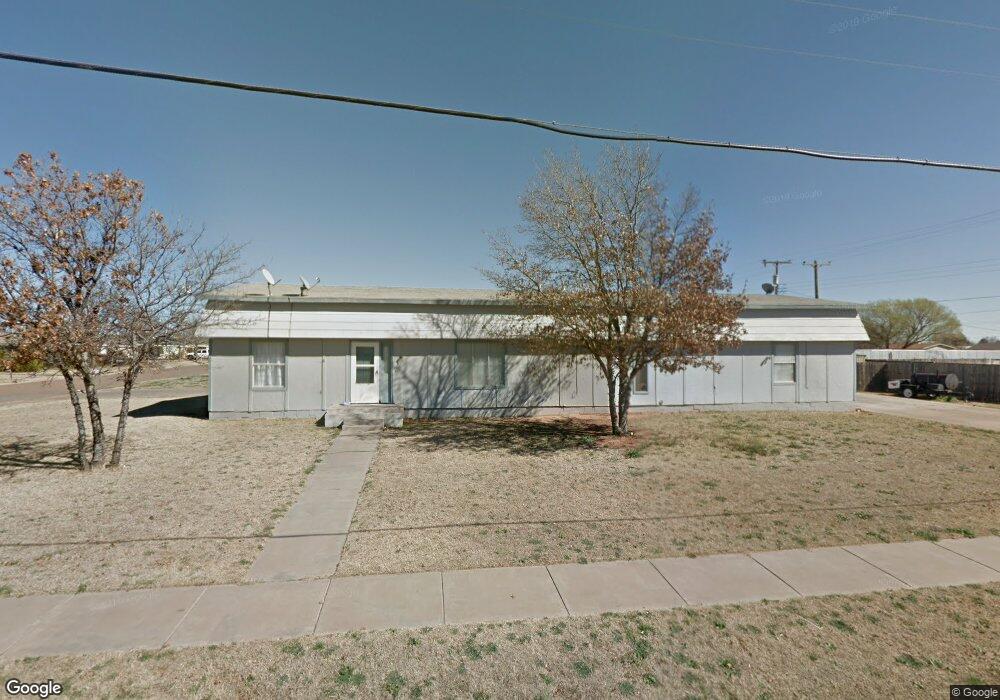
6221 20th St Lubbock, TX 79407
West End NeighborhoodEstimated Value: $188,000 - $253,000
4
Beds
2
Baths
2,560
Sq Ft
$84/Sq Ft
Est. Value
About This Home
This home is located at 6221 20th St, Lubbock, TX 79407 and is currently estimated at $214,110, approximately $83 per square foot. 6221 20th St is a home located in Lubbock County with nearby schools including Westwind Elementary School, Heritage Middle School, and Frenship High School.
Ownership History
Date
Name
Owned For
Owner Type
Purchase Details
Closed on
Jan 15, 2021
Sold by
Kp Series One
Bought by
Hart Glenda Pearcy
Current Estimated Value
Home Financials for this Owner
Home Financials are based on the most recent Mortgage that was taken out on this home.
Original Mortgage
$104,000
Outstanding Balance
$92,820
Interest Rate
2.71%
Mortgage Type
New Conventional
Estimated Equity
$121,290
Purchase Details
Closed on
Feb 5, 2019
Sold by
Gamboa Federico and Gamboa Margarita
Bought by
Lakeview Loan Servicing Llc
Purchase Details
Closed on
Jun 29, 2007
Sold by
Mcmahan George H
Bought by
Gamboa Federico and Gamboa Margarita
Home Financials for this Owner
Home Financials are based on the most recent Mortgage that was taken out on this home.
Original Mortgage
$77,090
Interest Rate
6.19%
Mortgage Type
Purchase Money Mortgage
Purchase Details
Closed on
Jun 28, 1993
Bought by
Gamboa Federico and Gamboa Margarita
Create a Home Valuation Report for This Property
The Home Valuation Report is an in-depth analysis detailing your home's value as well as a comparison with similar homes in the area
Home Values in the Area
Average Home Value in this Area
Purchase History
| Date | Buyer | Sale Price | Title Company |
|---|---|---|---|
| Hart Glenda Pearcy | -- | Service Title | |
| Lakeview Loan Servicing Llc | $75,914 | None Available | |
| Gamboa Federico | -- | Western Title Company | |
| Gamboa Federico | -- | -- |
Source: Public Records
Mortgage History
| Date | Status | Borrower | Loan Amount |
|---|---|---|---|
| Open | Hart Glenda Pearcy | $104,000 | |
| Previous Owner | Gamboa Federico | $77,090 |
Source: Public Records
Tax History Compared to Growth
Tax History
| Year | Tax Paid | Tax Assessment Tax Assessment Total Assessment is a certain percentage of the fair market value that is determined by local assessors to be the total taxable value of land and additions on the property. | Land | Improvement |
|---|---|---|---|---|
| 2025 | $2,215 | $107,280 | $5,200 | $102,080 |
| 2024 | $2,215 | $107,280 | $5,200 | $102,080 |
| 2023 | $2,246 | $107,280 | $5,200 | $102,080 |
| 2022 | $2,442 | $107,280 | $5,200 | $102,080 |
| 2021 | $3,159 | $130,640 | $5,200 | $125,440 |
| 2020 | $2,499 | $102,864 | $5,200 | $97,664 |
| 2019 | $2,572 | $102,864 | $5,200 | $97,664 |
| 2018 | $2,575 | $102,864 | $5,200 | $97,664 |
| 2017 | $1,971 | $78,677 | $5,200 | $73,477 |
| 2016 | $1,971 | $78,677 | $5,200 | $73,477 |
| 2015 | $1,439 | $57,364 | $5,200 | $52,164 |
| 2014 | $1,439 | $57,364 | $5,200 | $52,164 |
Source: Public Records
Map
Nearby Homes