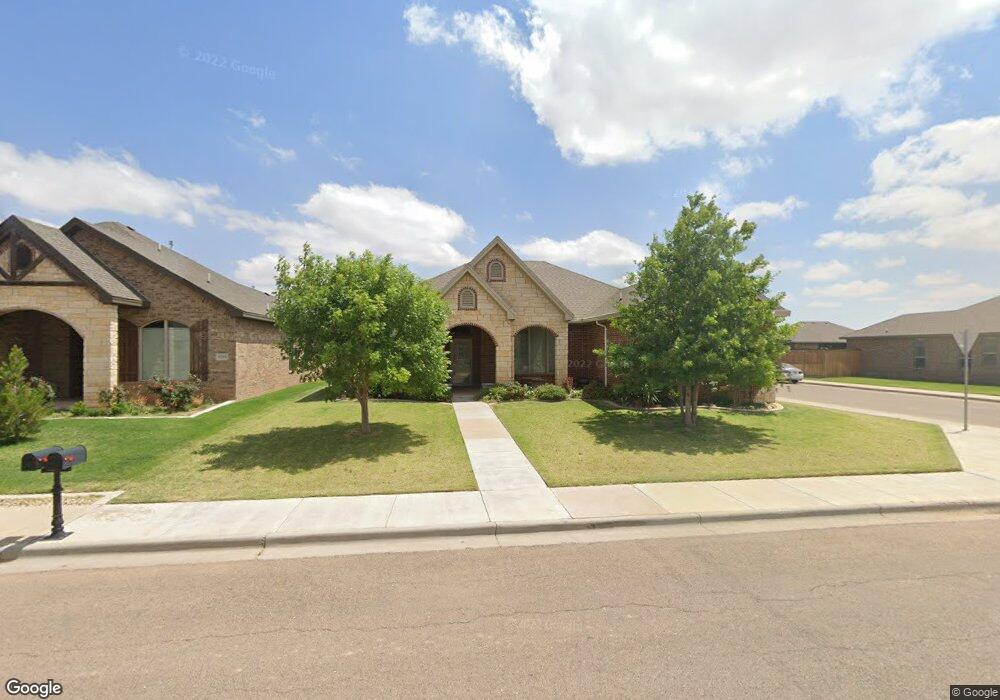
6221 94th St Lubbock, TX 79424
Estimated Value: $357,000 - $421,000
4
Beds
3
Baths
2,352
Sq Ft
$163/Sq Ft
Est. Value
About This Home
This home is located at 6221 94th St, Lubbock, TX 79424 and is currently estimated at $382,652, approximately $162 per square foot. 6221 94th St is a home located in Lubbock County with nearby schools including Crestview Elementary School, Heritage Middle School, and Frenship High School.
Ownership History
Date
Name
Owned For
Owner Type
Purchase Details
Closed on
May 26, 2020
Sold by
Estate Of Dang T Vu
Bought by
Vu Can Hung and Anderson Catherin
Current Estimated Value
Purchase Details
Closed on
Jan 13, 2016
Sold by
Roten Homes Inc
Bought by
Can Hung Vu
Home Financials for this Owner
Home Financials are based on the most recent Mortgage that was taken out on this home.
Original Mortgage
$180,650
Interest Rate
3.94%
Mortgage Type
New Conventional
Purchase Details
Closed on
Sep 25, 2015
Sold by
Day Estates Ltd
Bought by
Can Hung Vu
Create a Home Valuation Report for This Property
The Home Valuation Report is an in-depth analysis detailing your home's value as well as a comparison with similar homes in the area
Home Values in the Area
Average Home Value in this Area
Purchase History
| Date | Buyer | Sale Price | Title Company |
|---|---|---|---|
| Vu Can Hung | -- | None Available | |
| Can Hung Vu | $180,650 | Service Title | |
| Can Hung Vu | -- | -- |
Source: Public Records
Mortgage History
| Date | Status | Borrower | Loan Amount |
|---|---|---|---|
| Previous Owner | Can Hung Vu | $180,650 |
Source: Public Records
Tax History Compared to Growth
Tax History
| Year | Tax Paid | Tax Assessment Tax Assessment Total Assessment is a certain percentage of the fair market value that is determined by local assessors to be the total taxable value of land and additions on the property. | Land | Improvement |
|---|---|---|---|---|
| 2025 | $6,676 | $379,435 | $29,248 | $350,187 |
| 2024 | $6,676 | $379,435 | $29,248 | $350,187 |
| 2023 | $7,957 | $379,975 | $29,248 | $350,727 |
| 2022 | $8,514 | $373,977 | $29,248 | $344,729 |
| 2021 | $7,302 | $301,941 | $29,248 | $312,919 |
| 2020 | $6,669 | $274,492 | $29,248 | $245,244 |
| 2019 | $6,564 | $262,567 | $29,248 | $233,319 |
| 2018 | $6,370 | $254,519 | $29,248 | $225,271 |
| 2017 | $6,435 | $256,794 | $29,248 | $227,546 |
| 2016 | $6,435 | $256,794 | $29,248 | $227,546 |
Source: Public Records
Map
Nearby Homes