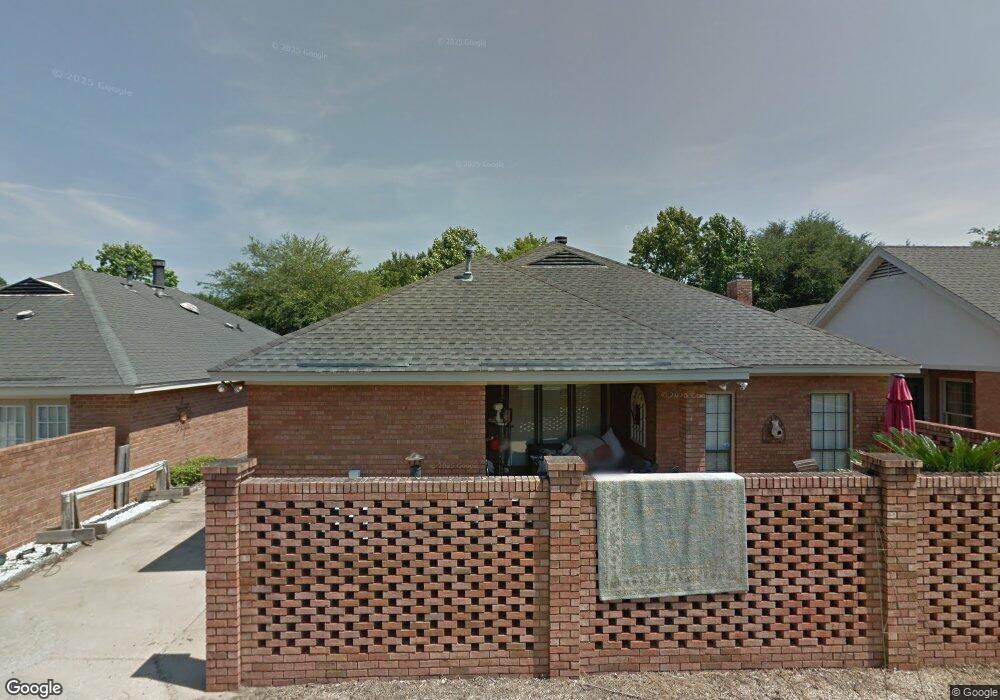
6221 Bell Grove Place Montgomery, AL 36117
East Montgomery NeighborhoodEstimated Value: $206,000 - $255,000
3
Beds
3
Baths
1,881
Sq Ft
$119/Sq Ft
Est. Value
About This Home
This home is located at 6221 Bell Grove Place, Montgomery, AL 36117 and is currently estimated at $223,719, approximately $118 per square foot. 6221 Bell Grove Place is a home located in Montgomery County with nearby schools including Halcyon Elementary School, Johnnie R. Carr Middle School, and Johnson Abernathy Graetz (JAG) High School.
Ownership History
Date
Name
Owned For
Owner Type
Purchase Details
Closed on
Sep 28, 2007
Sold by
Fannie Mae
Bought by
Lommen Jamie M
Current Estimated Value
Home Financials for this Owner
Home Financials are based on the most recent Mortgage that was taken out on this home.
Original Mortgage
$100,000
Outstanding Balance
$63,053
Interest Rate
6.49%
Mortgage Type
Purchase Money Mortgage
Estimated Equity
$160,666
Purchase Details
Closed on
Dec 18, 2006
Sold by
Regions Bank
Bought by
Federal National Mortgage Association
Purchase Details
Closed on
Dec 14, 2006
Sold by
Donley Craig A
Bought by
Regions Bank Na
Purchase Details
Closed on
Dec 27, 2002
Sold by
Donley Rex C and Donley Dale C
Bought by
Donley Craig A
Home Financials for this Owner
Home Financials are based on the most recent Mortgage that was taken out on this home.
Original Mortgage
$126,100
Interest Rate
5.99%
Create a Home Valuation Report for This Property
The Home Valuation Report is an in-depth analysis detailing your home's value as well as a comparison with similar homes in the area
Home Values in the Area
Average Home Value in this Area
Purchase History
| Date | Buyer | Sale Price | Title Company |
|---|---|---|---|
| Lommen Jamie M | $144,000 | None Available | |
| Federal National Mortgage Association | -- | None Available | |
| Regions Bank Na | $119,126 | None Available | |
| Donley Craig A | $130,100 | -- |
Source: Public Records
Mortgage History
| Date | Status | Borrower | Loan Amount |
|---|---|---|---|
| Open | Lommen Jamie M | $100,000 | |
| Previous Owner | Donley Craig A | $126,100 |
Source: Public Records
Tax History Compared to Growth
Tax History
| Year | Tax Paid | Tax Assessment Tax Assessment Total Assessment is a certain percentage of the fair market value that is determined by local assessors to be the total taxable value of land and additions on the property. | Land | Improvement |
|---|---|---|---|---|
| 2025 | $896 | $19,150 | $2,000 | $17,150 |
| 2024 | $836 | $17,880 | $2,000 | $15,880 |
| 2023 | $836 | $17,110 | $2,000 | $15,110 |
| 2022 | $496 | $14,700 | $2,000 | $12,700 |
| 2021 | $427 | $12,820 | $0 | $0 |
| 2020 | $445 | $13,320 | $2,000 | $11,320 |
| 2019 | $431 | $12,910 | $2,000 | $10,910 |
| 2018 | $468 | $12,810 | $2,000 | $10,810 |
| 2017 | $404 | $24,380 | $5,260 | $19,120 |
| 2014 | $436 | $13,060 | $3,500 | $9,560 |
| 2013 | -- | $13,320 | $3,500 | $9,820 |
Source: Public Records
Map
Nearby Homes
- 6232 Bell Road Ct
- 148 Charleston Ct N
- 116 Charleston Ct N
- 272 Carolina Ct
- 6121 Bell Road Manor
- 6259 Bell Gables
- 6512 Ashton Cir
- 448 Duckworth Dr
- 6224 Hunters Grove
- 5904 Carmel Dr
- 5922 Havenwood Dr
- 6272 Nature Dr
- 6037 Burbank Crossing Loop
- 6204 Lycoming Rd
- 225 Townsend Dr
- 6545 Ridgeview Cir
- 6258 Monticello Dr
- 6266 Monticello Dr
- 6274 Monticello Dr
- 6282 Monticello Dr
- 6217 Bell Grove Place
- 6225 Bell Grove Place
- 6213 Bell Grove Place
- 6229 Bell Grove Place
- 6208 Bell Road Ct
- 6220 Bell Grove Place
- 6216 Bell Grove Place
- 6224 Bell Grove Place
- 6209 Bell Grove Place
- 6233 Bell Grove Place
- 6212 Bell Grove Place
- 6216 Bell Road Ct
- 6228 Bell Grove Place
- 6200 Bell Road Ct
- 6237 Bell Grove Place
- 6208 Bell Grove Place
- 6232 Bell Grove Place
- 6201 Bell Grove Place
- 6204 Bell Grove Place
- 6241 Bell Grove Place