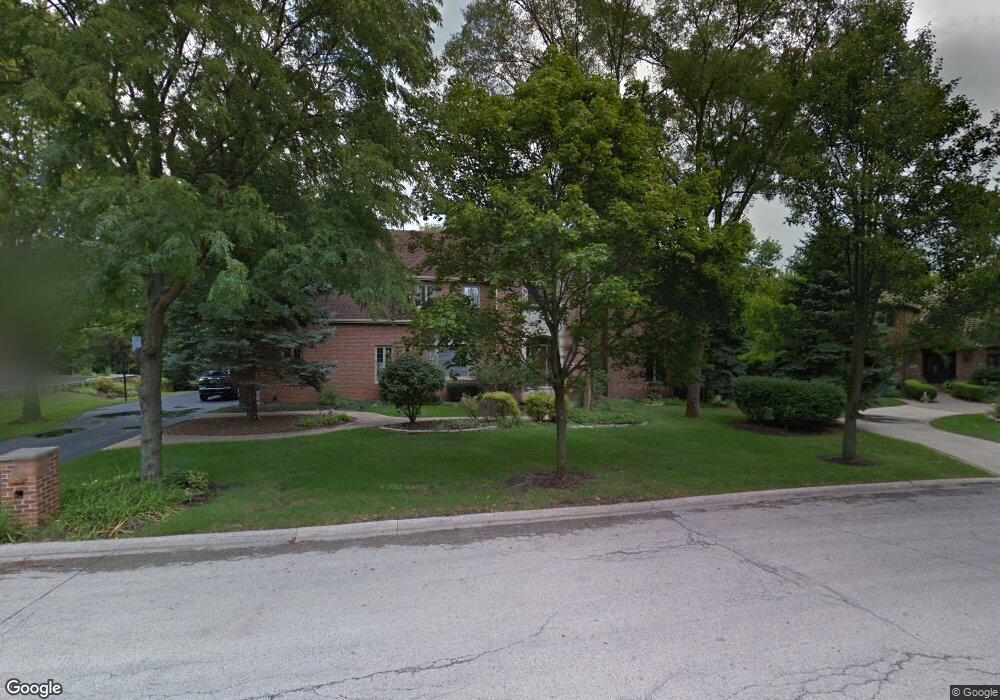
6221 Cove Creek Ct Burr Ridge, IL 60527
Estimated Value: $1,258,000 - $1,463,109
5
Beds
6
Baths
4,013
Sq Ft
$338/Sq Ft
Est. Value
About This Home
This home is located at 6221 Cove Creek Ct, Burr Ridge, IL 60527 and is currently estimated at $1,356,036, approximately $337 per square foot. 6221 Cove Creek Ct is a home located in DuPage County with nearby schools including Elm Elementary School, Hinsdale Middle School, and Hinsdale Central High School.
Ownership History
Date
Name
Owned For
Owner Type
Purchase Details
Closed on
May 16, 2011
Sold by
Schwenger Bruce S and The Bruce S Schwenger Trust
Bought by
Simon Russell J and Simon Iona J
Current Estimated Value
Home Financials for this Owner
Home Financials are based on the most recent Mortgage that was taken out on this home.
Original Mortgage
$400,000
Outstanding Balance
$278,365
Interest Rate
4.91%
Mortgage Type
New Conventional
Estimated Equity
$1,077,671
Purchase Details
Closed on
Oct 6, 2005
Sold by
Schwenger Bruce and Schwenger Lesley Joanne
Bought by
Schwenger Bruce S and Schwenger Lesley J
Purchase Details
Closed on
Oct 13, 2000
Sold by
Lind David R and Lind Cynthia L
Bought by
Schwenger Bruce and Schwenger Lesley Joanne
Purchase Details
Closed on
Nov 29, 1993
Sold by
Lind David R and Lind Cynthia L
Bought by
Lind David R and Lind Cynthia L
Create a Home Valuation Report for This Property
The Home Valuation Report is an in-depth analysis detailing your home's value as well as a comparison with similar homes in the area
Home Values in the Area
Average Home Value in this Area
Purchase History
| Date | Buyer | Sale Price | Title Company |
|---|---|---|---|
| Simon Russell J | $1,199,000 | 1St American Title | |
| Schwenger Bruce S | -- | -- | |
| Schwenger Bruce | $930,000 | -- | |
| Lind David R | -- | -- |
Source: Public Records
Mortgage History
| Date | Status | Borrower | Loan Amount |
|---|---|---|---|
| Open | Simon Russell J | $400,000 |
Source: Public Records
Tax History Compared to Growth
Tax History
| Year | Tax Paid | Tax Assessment Tax Assessment Total Assessment is a certain percentage of the fair market value that is determined by local assessors to be the total taxable value of land and additions on the property. | Land | Improvement |
|---|---|---|---|---|
| 2024 | $22,186 | $397,250 | $176,811 | $220,439 |
| 2023 | $23,033 | $397,250 | $162,540 | $234,710 |
| 2022 | $19,672 | $346,480 | $156,150 | $190,330 |
| 2021 | $22,141 | $402,620 | $154,370 | $248,250 |
| 2020 | $22,208 | $394,640 | $151,310 | $243,330 |
| 2019 | $22,069 | $378,660 | $145,180 | $233,480 |
| 2018 | $22,110 | $396,400 | $144,310 | $252,090 |
| 2017 | $23,013 | $408,400 | $138,870 | $269,530 |
| 2016 | $22,658 | $389,760 | $132,530 | $257,230 |
| 2015 | $22,720 | $366,700 | $124,690 | $242,010 |
| 2014 | $21,555 | $340,960 | $136,350 | $204,610 |
| 2013 | $21,370 | $339,360 | $135,710 | $203,650 |
Source: Public Records
Map
Nearby Homes
- 335 Countryside Ct
- 15W371 61st Place
- 1604 Burr Ridge Club
- 6116 S County Line Rd
- 6191 S County Line Rd
- 6403 S County Line Rd
- 15W080 60th St
- 6413 S County Line Rd
- 6423 S County Line Rd
- 15W170 60th St
- 15W120 60th St
- 804 Kenmare Dr
- 802 Kenmare Dr
- 6500 Shady Ln
- 421 Creekside Ct
- 320 Claymoor Unit 2D
- 300 Claymoor Unit 2E
- 6655 Lee Ct
- 6447 Manor Dr
- 6923 Fieldstone Dr
- 6231 Cove Creek Ct
- 6262 S Elm St
- 6211 Cove Creek Ct
- 6210 Cove Creek Ct
- 6230 Cove Creek Ct
- 6212 S Elm St
- 6224 S Elm St
- 6201 Cove Creek Ct
- 6230 S Elm St
- 15W239 62nd St
- 6200 Cove Creek Ct
- 15W271 62nd St
- 6300 S Elm St
- 15W248 62nd St
- 15W244 62nd St
- 901 Burr Ridge Club
- 15W240 62nd St
- 15W252 62nd St
- 901 Burr Ridge Club Dr
- 902 Burr Ridge Club