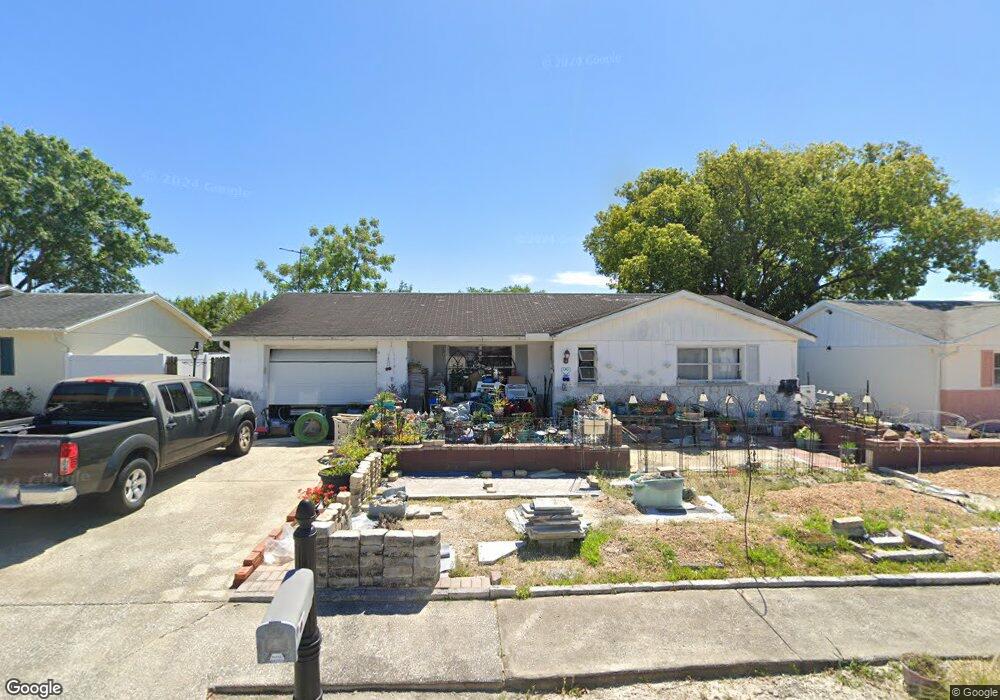
6222 Langston Ave New Port Richey, FL 34653
Estimated Value: $201,000 - $234,000
2
Beds
2
Baths
1,258
Sq Ft
$176/Sq Ft
Est. Value
About This Home
This home is located at 6222 Langston Ave, New Port Richey, FL 34653 and is currently estimated at $221,050, approximately $175 per square foot. 6222 Langston Ave is a home located in Pasco County with nearby schools including Richey Elementary School, Gulf Middle School, and Gulf High School.
Ownership History
Date
Name
Owned For
Owner Type
Purchase Details
Closed on
Dec 23, 2008
Sold by
Hsbc Bank Usa National Association
Bought by
Brock Linda Lee
Current Estimated Value
Purchase Details
Closed on
Aug 27, 2008
Sold by
Yagoub Ibrahim Mohamed Mu
Bought by
Hsbc Bank Usa Na and Fremont Home Loan Trust 2006-B
Purchase Details
Closed on
May 30, 2006
Sold by
Maisevich Barbara Ann and Vunk Barbara Ann
Bought by
Yagoub Ibrahim Mohamed Mu
Home Financials for this Owner
Home Financials are based on the most recent Mortgage that was taken out on this home.
Original Mortgage
$114,746
Interest Rate
7.75%
Mortgage Type
Fannie Mae Freddie Mac
Purchase Details
Closed on
Feb 26, 2002
Sold by
Spegal Lila A
Bought by
Vunk Barbara A
Home Financials for this Owner
Home Financials are based on the most recent Mortgage that was taken out on this home.
Original Mortgage
$50,500
Interest Rate
7.02%
Mortgage Type
New Conventional
Create a Home Valuation Report for This Property
The Home Valuation Report is an in-depth analysis detailing your home's value as well as a comparison with similar homes in the area
Home Values in the Area
Average Home Value in this Area
Purchase History
| Date | Buyer | Sale Price | Title Company |
|---|---|---|---|
| Brock Linda Lee | $49,900 | Southern Fincl Title Svcs | |
| Hsbc Bank Usa Na | -- | Attorney | |
| Yagoub Ibrahim Mohamed Mu | $134,996 | None Available | |
| Vunk Barbara A | $66,500 | -- |
Source: Public Records
Mortgage History
| Date | Status | Borrower | Loan Amount |
|---|---|---|---|
| Previous Owner | Yagoub Ibrahim Mohamed Mu | $114,746 | |
| Previous Owner | Vunk Barbara A | $50,500 |
Source: Public Records
Tax History Compared to Growth
Tax History
| Year | Tax Paid | Tax Assessment Tax Assessment Total Assessment is a certain percentage of the fair market value that is determined by local assessors to be the total taxable value of land and additions on the property. | Land | Improvement |
|---|---|---|---|---|
| 2025 | $642 | $54,060 | -- | -- |
| 2024 | $642 | $52,540 | -- | -- |
| 2023 | $623 | $51,010 | $0 | $0 |
| 2022 | $573 | $49,530 | $0 | $0 |
| 2021 | $549 | $48,090 | $18,228 | $29,862 |
| 2020 | $532 | $47,430 | $9,114 | $38,316 |
| 2019 | $512 | $46,370 | $0 | $0 |
| 2018 | $492 | $45,511 | $0 | $0 |
| 2017 | $483 | $45,511 | $0 | $0 |
| 2016 | $431 | $43,658 | $0 | $0 |
| 2015 | $433 | $43,355 | $0 | $0 |
| 2014 | $412 | $43,011 | $9,114 | $33,897 |
Source: Public Records
Map
Nearby Homes
- 6325 Baldwyn Ave
- 6333 Aberdeen Ave
- 6306 Aberdeen Ave
- 6307 Tralee Ave
- 6443 Limerick Ave
- 6246 Bandura Ave
- 7446 Donegal St
- 5838 Sun Glo Ave
- 6534 Jingo Ln
- 5808 Sun Glo Ave
- 6531 Ketch Ln
- 7814 Chapel Ave
- 5701 Regis Ave
- 7730 Chapel Ave
- 6534 Ketch Ln
- 5924 Lantern Ct
- 5647 Lorenzen Rd
- 6428 Kentfield Ave
- 6705 Lamprey Ln
- 6701 Lamprey Ln
- 6228 Langston Ave
- 6216 Langston Ave
- 6223 Moray Ave
- 6229 Moray Ave
- 6217 Moray Ave Unit 4
- 6234 Langston Ave
- 6210 Langston Ave
- 6225 Langston Ave
- 6219 Langston Ave
- 6235 Moray Ave
- 6211 Moray Ave
- 6231 Langston Ave
- 6213 Langston Ave
- 6204 Langston Ave
- 6239 Langston Ave
- 6205 Moray Ave Unit 4
- 6207 Langston Ave
- 6222 Moray Ave
- 6228 Moray Ave
- 6216 Moray Ave