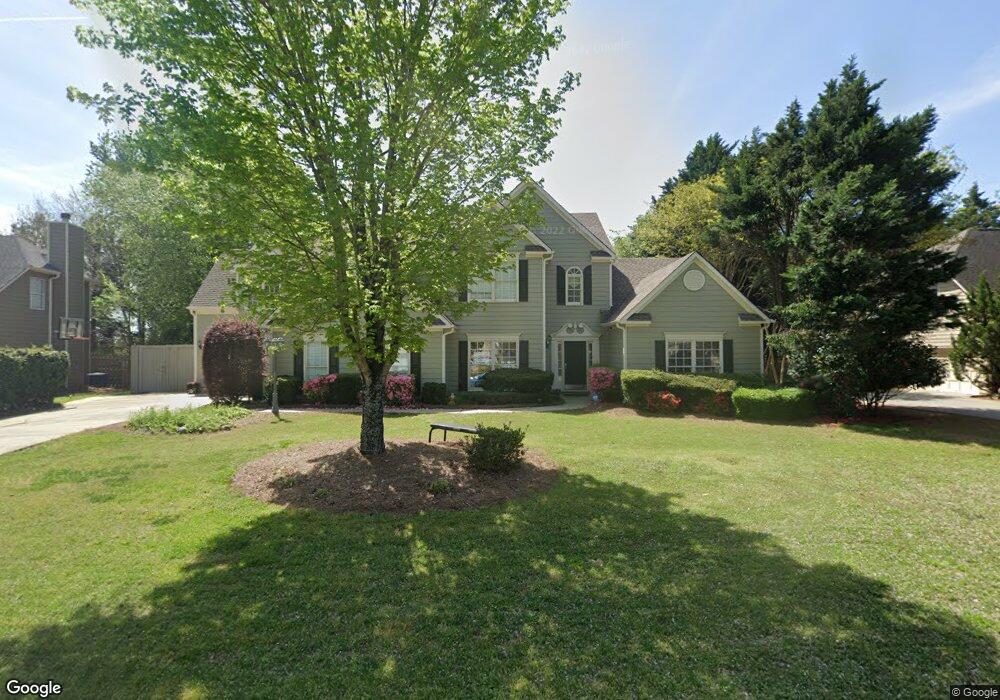
6222 Spring Lake Dr Flowery Branch, GA 30542
Estimated Value: $471,000 - $561,000
5
Beds
4
Baths
3,975
Sq Ft
$130/Sq Ft
Est. Value
About This Home
This home is located at 6222 Spring Lake Dr, Flowery Branch, GA 30542 and is currently estimated at $516,392, approximately $129 per square foot. 6222 Spring Lake Dr is a home located in Hall County with nearby schools including Flowery Branch Elementary School, West Hall Middle School, and West Hall High School.
Ownership History
Date
Name
Owned For
Owner Type
Purchase Details
Closed on
May 14, 2019
Sold by
Kyle Diane G
Bought by
Miller Michael and Miller Daphne
Current Estimated Value
Home Financials for this Owner
Home Financials are based on the most recent Mortgage that was taken out on this home.
Original Mortgage
$200,000
Outstanding Balance
$130,183
Interest Rate
4.1%
Mortgage Type
New Conventional
Estimated Equity
$386,209
Purchase Details
Closed on
Jun 10, 2005
Sold by
Wilson Barry P and Wilson Geralyn
Bought by
Kyle Richard L and Kyle Diane
Home Financials for this Owner
Home Financials are based on the most recent Mortgage that was taken out on this home.
Original Mortgage
$177,600
Interest Rate
5.69%
Mortgage Type
New Conventional
Purchase Details
Closed on
Aug 28, 1995
Sold by
Mccar Devel Corp
Bought by
Wilson Barry P Geralyn
Purchase Details
Closed on
May 3, 1995
Sold by
Stonebridge Dev Elopment Corp
Bought by
Mccar Developme Nt Corp
Purchase Details
Closed on
May 1, 1995
Create a Home Valuation Report for This Property
The Home Valuation Report is an in-depth analysis detailing your home's value as well as a comparison with similar homes in the area
Home Values in the Area
Average Home Value in this Area
Purchase History
| Date | Buyer | Sale Price | Title Company |
|---|---|---|---|
| Miller Michael | $235,000 | -- | |
| Kyle Richard L | $222,000 | -- | |
| Wilson Barry P Geralyn | $151,800 | -- | |
| Mccar Developme Nt Corp | $25,000 | -- | |
| -- | $25,000 | -- |
Source: Public Records
Mortgage History
| Date | Status | Borrower | Loan Amount |
|---|---|---|---|
| Open | Miller Michael | $200,000 | |
| Previous Owner | Kyle Richard L | $177,600 | |
| Closed | Mccar Developme Nt Corp | $0 |
Source: Public Records
Tax History Compared to Growth
Tax History
| Year | Tax Paid | Tax Assessment Tax Assessment Total Assessment is a certain percentage of the fair market value that is determined by local assessors to be the total taxable value of land and additions on the property. | Land | Improvement |
|---|---|---|---|---|
| 2024 | $4,570 | $182,200 | $28,600 | $153,600 |
| 2023 | $4,618 | $184,160 | $28,280 | $155,880 |
| 2022 | $3,829 | $145,960 | $25,720 | $120,240 |
| 2021 | $3,132 | $116,640 | $17,160 | $99,480 |
| 2020 | $2,612 | $105,960 | $11,440 | $94,520 |
| 2019 | $3,333 | $119,600 | $14,440 | $105,160 |
| 2018 | $3,161 | $109,640 | $14,920 | $94,720 |
| 2017 | $3,103 | $108,720 | $12,080 | $96,640 |
| 2016 | $2,813 | $100,800 | $12,080 | $88,720 |
| 2015 | $2,586 | $91,680 | $10,880 | $80,800 |
| 2014 | $2,586 | $91,680 | $10,880 | $80,800 |
Source: Public Records
Map
Nearby Homes
- 6414 Deep Valley Ct Unit 14081408
- 6308 Chestnut Hill Rd
- SUDBURY 24' TOWNHOME Plan at Waypoint
- ADDINGTON Plan at Waypoint
- SALISBURY 24' TOWNHOME Plan at Waypoint
- AMESBURY Plan at Waypoint
- 6660 Parsons St
- 6416 Deep Woods Ct
- 6749 Leigh St
- 6740 Leigh St
- 6732 Leigh St
- 6737 Leigh St
- 6745 Leigh St
- 6714 Corryton St
- 6664 Parsons St
- 6218 Spring Lake Dr
- 6226 Spring Lake Dr
- 6223 Spring Lake Dr
- 6230 Spring Lake Dr
- 6214 Spring Lake Dr
- 6219 Spring Lake Dr
- 6227 Spring Lake Dr
- 6215 Spring Lake Dr
- 6234 Spring Lake Dr
- 6211 Spring Lake Dr
- 6238 Spring Lake Dr
- 6206 Spring Lake Dr
- 6235 Spring Lake Dr
- 6207 Spring Lake Dr
- 6406 Deep Valley Ct Unit 14081408
- 0 Deep Valley Ct Unit 7214057
- 0 Deep Valley Ct Unit 8985363
- 0 Deep Valley Ct Unit 8842564
- 0 Deep Valley Ct Unit 3178518
- 0 Deep Valley Ct Unit 7028661