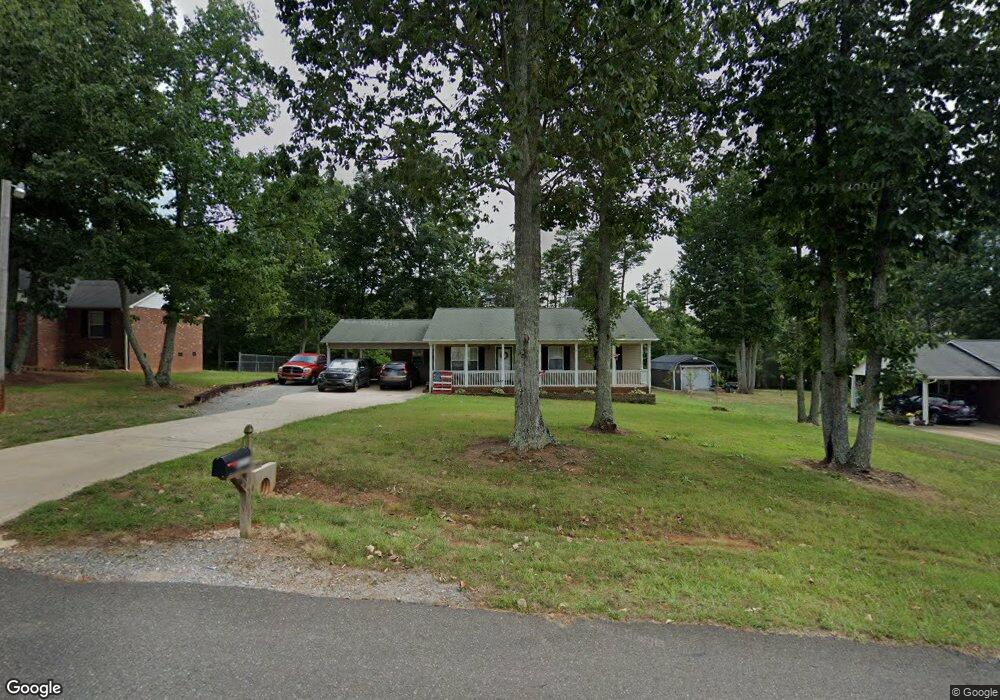
6223 Adele St Kings Mountain, NC 28086
Estimated Value: $238,000 - $265,000
3
Beds
2
Baths
1,040
Sq Ft
$239/Sq Ft
Est. Value
About This Home
This home is located at 6223 Adele St, Kings Mountain, NC 28086 and is currently estimated at $248,984, approximately $239 per square foot. 6223 Adele St is a home located in Cleveland County with nearby schools including Grover Elementary School, Kings Mountain Middle, and Kings Mountain Intermediate School.
Ownership History
Date
Name
Owned For
Owner Type
Purchase Details
Closed on
Sep 22, 2022
Sold by
Kates Adam D and Kates Katie B
Bought by
Melton Zachary G
Current Estimated Value
Home Financials for this Owner
Home Financials are based on the most recent Mortgage that was taken out on this home.
Original Mortgage
$237,336
Outstanding Balance
$225,078
Interest Rate
5.22%
Mortgage Type
VA
Estimated Equity
$23,906
Purchase Details
Closed on
Oct 22, 2015
Sold by
Rohrman Laurence N
Bought by
Kates Adam D and Kates Jerry R
Home Financials for this Owner
Home Financials are based on the most recent Mortgage that was taken out on this home.
Original Mortgage
$77,077
Interest Rate
4.25%
Mortgage Type
FHA
Purchase Details
Closed on
Oct 26, 2011
Sold by
Rohrman Laurence N and Rohrman Marsha B
Bought by
Rohrman Laurence N and Rohrman Marsha B
Create a Home Valuation Report for This Property
The Home Valuation Report is an in-depth analysis detailing your home's value as well as a comparison with similar homes in the area
Home Values in the Area
Average Home Value in this Area
Purchase History
| Date | Buyer | Sale Price | Title Company |
|---|---|---|---|
| Melton Zachary G | $232,000 | None Listed On Document | |
| Kates Adam D | $78,500 | None Available | |
| Rohrman Laurence N | -- | None Available | |
| Rohrman Laurence N | -- | Attorney |
Source: Public Records
Mortgage History
| Date | Status | Borrower | Loan Amount |
|---|---|---|---|
| Open | Melton Zachary G | $237,336 | |
| Previous Owner | Kates Adam D | $77,077 |
Source: Public Records
Tax History
| Year | Tax Paid | Tax Assessment Tax Assessment Total Assessment is a certain percentage of the fair market value that is determined by local assessors to be the total taxable value of land and additions on the property. | Land | Improvement |
|---|---|---|---|---|
| 2025 | $1,376 | $223,704 | $20,516 | $203,188 |
| 2024 | $1,206 | $145,294 | $13,591 | $131,703 |
| 2023 | $1,200 | $145,294 | $13,591 | $131,703 |
| 2022 | $1,171 | $141,478 | $13,591 | $127,887 |
| 2021 | $1,174 | $141,478 | $13,591 | $127,887 |
| 2020 | $865 | $98,021 | $9,488 | $88,533 |
| 2019 | $865 | $98,021 | $9,488 | $88,533 |
| 2018 | $861 | $98,021 | $9,488 | $88,533 |
| 2017 | $857 | $98,021 | $9,488 | $88,533 |
| 2016 | $817 | $98,021 | $9,488 | $88,533 |
| 2015 | $811 | $97,270 | $8,548 | $88,722 |
| 2014 | $811 | $97,270 | $8,548 | $88,722 |
Source: Public Records
Map
Nearby Homes
- 432 Brinkley Dr
- 191 Belcaro Dr
- 163 Kipling Ln
- 504 Brinkley Dr
- 505 Brinkley Dr
- 425 Brinkley Dr
- 431 Brinkley Dr
- 293 Belcaro Dr
- 207 Fairdale St
- 231 Brinkley Dr
- 0 Margrace Rd
- 223 Frank Burns Way
- 143 Colton Ct
- 131 Colton Ct
- 125 Colton Ct
- 119 Colton Ct
- 113 Colton Ct
- 00000 Crocker Rd
- 104 Carol Lyn Rd
- 212 Paige Rd
Your Personal Tour Guide
Ask me questions while you tour the home.