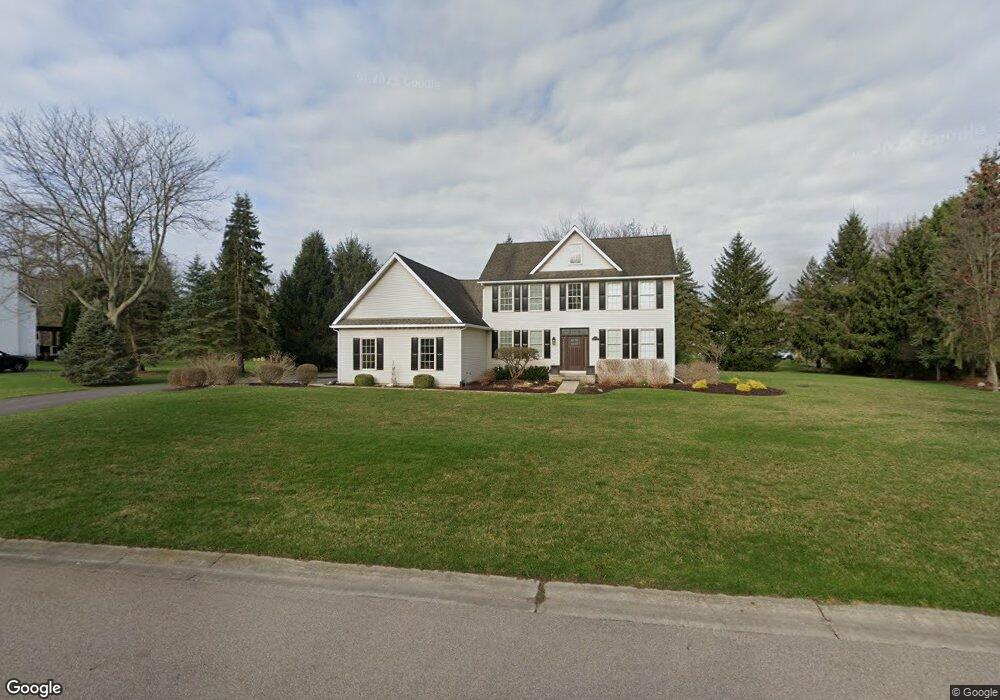
6223 Chad Ct Unit 12 Brighton, MI 48116
Estimated Value: $558,455 - $648,000
4
Beds
3
Baths
2,528
Sq Ft
$243/Sq Ft
Est. Value
About This Home
This home is located at 6223 Chad Ct Unit 12, Brighton, MI 48116 and is currently estimated at $614,864, approximately $243 per square foot. 6223 Chad Ct Unit 12 is a home located in Livingston County with nearby schools including Hornung Elementary School, Scranton Middle School, and Brighton High School.
Ownership History
Date
Name
Owned For
Owner Type
Purchase Details
Closed on
Mar 29, 2019
Sold by
Devost Patricia A
Bought by
Devost Ft
Current Estimated Value
Purchase Details
Closed on
Sep 23, 2011
Sold by
Krayer Joseph P and Krayer Jessica
Bought by
Devost Patricia A
Purchase Details
Closed on
Nov 5, 2004
Sold by
Prudential Relocation Inc
Bought by
Krayer Joseph P and Krayer Jessica
Home Financials for this Owner
Home Financials are based on the most recent Mortgage that was taken out on this home.
Original Mortgage
$243,000
Interest Rate
5.86%
Mortgage Type
Balloon
Purchase Details
Closed on
Oct 25, 2004
Sold by
Stiller Samuel and Stiller Missy
Bought by
Prudential Relocation Inc
Home Financials for this Owner
Home Financials are based on the most recent Mortgage that was taken out on this home.
Original Mortgage
$243,000
Interest Rate
5.86%
Mortgage Type
Balloon
Purchase Details
Closed on
Feb 25, 2003
Sold by
Sykes Jeffrey J and Sykes Jennifer R
Bought by
Stiller Samuel and Stiller Missy
Create a Home Valuation Report for This Property
The Home Valuation Report is an in-depth analysis detailing your home's value as well as a comparison with similar homes in the area
Home Values in the Area
Average Home Value in this Area
Purchase History
| Date | Buyer | Sale Price | Title Company |
|---|---|---|---|
| Devost Ft | -- | -- | |
| Devost Patricia A | $263,300 | -- | |
| Krayer Joseph P | $353,000 | Philip R Seaver Title Co Inc | |
| Prudential Relocation Inc | $353,000 | Seaver Title | |
| Stiller Samuel | $331,000 | American Title Co Of Livings |
Source: Public Records
Mortgage History
| Date | Status | Borrower | Loan Amount |
|---|---|---|---|
| Previous Owner | Krayer Joseph P | $243,000 |
Source: Public Records
Tax History Compared to Growth
Tax History
| Year | Tax Paid | Tax Assessment Tax Assessment Total Assessment is a certain percentage of the fair market value that is determined by local assessors to be the total taxable value of land and additions on the property. | Land | Improvement |
|---|---|---|---|---|
| 2025 | $4,103 | $253,180 | $0 | $0 |
| 2024 | $1,955 | $247,800 | $0 | $0 |
| 2023 | $1,869 | $234,220 | $0 | $0 |
| 2022 | $2,076 | $188,110 | $0 | $0 |
| 2021 | $3,739 | $188,110 | $0 | $0 |
| 2020 | $3,707 | $171,240 | $0 | $0 |
| 2019 | $3,655 | $169,480 | $0 | $0 |
| 2018 | $3,611 | $161,880 | $0 | $0 |
| 2017 | $3,414 | $161,880 | $0 | $0 |
| 2016 | $3,395 | $162,540 | $0 | $0 |
| 2014 | $2,851 | $127,200 | $0 | $0 |
| 2012 | $2,851 | $122,750 | $0 | $0 |
Source: Public Records
Map
Nearby Homes
- 6252 Northridge Hills Dr Unit 66
- 57 Wyndam Ln
- 6240 Northridge Hills Dr
- 6277 Northridge Woods Dr
- 36 Pinemont Dr
- 31 Pinemont Dr
- 32 Pinemont Dr
- Unit 23 Pine Creek B Rexford Ct
- 5972 Wyndam Ln
- 25 Rexford Ct
- 41 Pinemont Dr
- 15 Wyndam Ln
- 24 Rexford Ct
- 21 Rexford Ct
- 53 Pinemont Dr
- 43 Pinemont Dr
- 44 Pinemont Dr
- 55 Wyndam Ln
- 58 Wyndam Ln
- 5971 Barclay Dr
- 6199 Chad Ct Unit 13
- 6247 Chad Ct
- 7852 Winfield Dr
- 7876 Winfield Dr
- 6228 Chad Ct
- 6204 Chad Ct Unit 23
- 7828 Winfield Dr
- 6175 Chad Ct
- 7892 Winfield Dr
- 6252 Chad Ct
- 6180 Chad Ct
- 6293 Chad Ct
- 7867 Winfield Dr
- 6151 Chad Ct
- 6156 Chad Ct
- 7881 Winfield Dr Unit 58
- 6204 Kevin Dr
- 7896 Winfield Dr Unit 34
- 7815 Winfield Dr
- 7803 Winfield Dr Unit 6