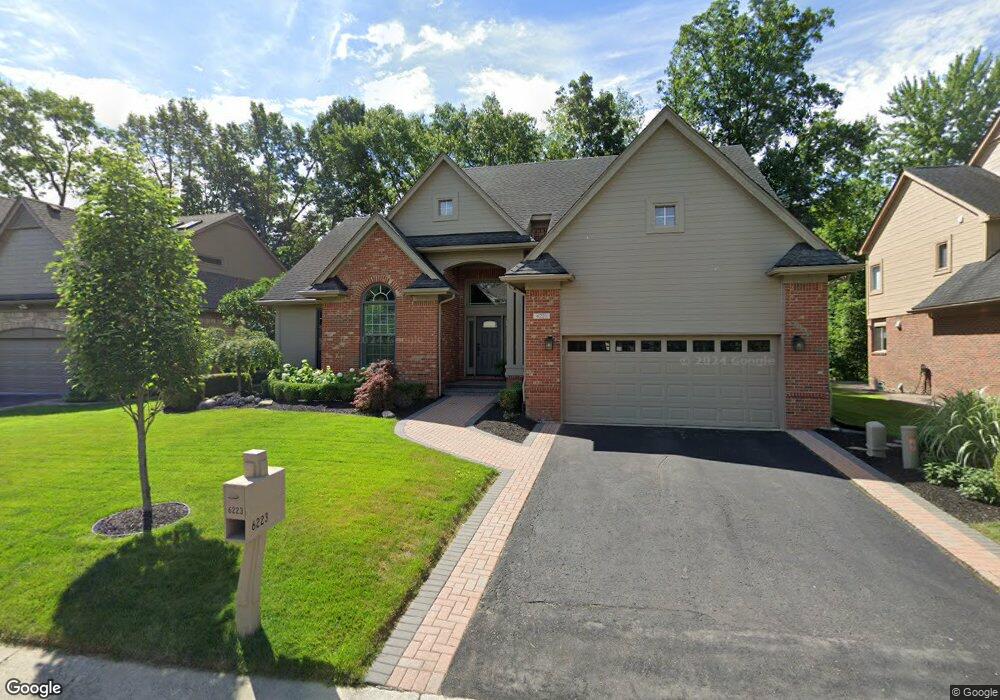
6223 Lynn Ct Unit Bldg-Unit West Bloomfield, MI 48323
Estimated Value: $539,850 - $641,000
3
Beds
3
Baths
2,434
Sq Ft
$252/Sq Ft
Est. Value
About This Home
This home is located at 6223 Lynn Ct Unit Bldg-Unit, West Bloomfield, MI 48323 and is currently estimated at $612,463, approximately $251 per square foot. 6223 Lynn Ct Unit Bldg-Unit is a home located in Oakland County with nearby schools including Walled Lake Central High School, The Susan And Rabbi Harold Loss Ecc, and Brookfield Academy - West Bloomfield.
Ownership History
Date
Name
Owned For
Owner Type
Purchase Details
Closed on
Dec 1, 2021
Sold by
Ray Dunivant Larry and Ray Marie Virginia
Bought by
Dunivant Living Trust
Current Estimated Value
Purchase Details
Closed on
Jun 8, 2018
Sold by
Ham Young Ki
Bought by
Dunivant Larry R and Dunivant Virginia M
Purchase Details
Closed on
Jan 10, 2013
Sold by
Lewandowski John and Lewandowski Virginia
Bought by
Ham Young Ki
Purchase Details
Closed on
Mar 20, 2008
Sold by
Zak Marsha
Bought by
Lewandowski John and Lewandowski Virginia
Purchase Details
Closed on
Jan 20, 2006
Sold by
Babineau Thomas M and Babineau Toni Wilen
Bought by
Zak Marsha G
Purchase Details
Closed on
Sep 16, 1997
Sold by
Mjc Torrey Ridge
Bought by
Babineau Thomas M
Home Financials for this Owner
Home Financials are based on the most recent Mortgage that was taken out on this home.
Original Mortgage
$254,375
Interest Rate
7.63%
Purchase Details
Closed on
May 22, 1997
Sold by
Ivanhoe Huntley Torrey R
Bought by
Mjc Torrey Ridge
Create a Home Valuation Report for This Property
The Home Valuation Report is an in-depth analysis detailing your home's value as well as a comparison with similar homes in the area
Home Values in the Area
Average Home Value in this Area
Purchase History
| Date | Buyer | Sale Price | Title Company |
|---|---|---|---|
| Dunivant Living Trust | -- | Kuthy Douglas E | |
| Dunivant Larry R | $380,000 | None Available | |
| Ham Young Ki | $328,000 | Capital Title Ins Agency | |
| Lewandowski John | $350,000 | None Available | |
| Zak Marsha G | $390,000 | Devon Title Agency | |
| Babineau Thomas M | $299,265 | -- | |
| Mjc Torrey Ridge | -- | -- |
Source: Public Records
Mortgage History
| Date | Status | Borrower | Loan Amount |
|---|---|---|---|
| Previous Owner | Babineau Thomas M | $254,375 |
Source: Public Records
Tax History Compared to Growth
Tax History
| Year | Tax Paid | Tax Assessment Tax Assessment Total Assessment is a certain percentage of the fair market value that is determined by local assessors to be the total taxable value of land and additions on the property. | Land | Improvement |
|---|---|---|---|---|
| 2024 | $3,652 | $212,880 | $0 | $0 |
| 2022 | $3,443 | $177,900 | $22,800 | $155,100 |
| 2021 | $5,693 | $174,630 | $0 | $0 |
| 2020 | $3,402 | $172,550 | $22,800 | $149,750 |
| 2018 | $5,216 | $154,250 | $24,000 | $130,250 |
| 2015 | -- | $149,460 | $0 | $0 |
| 2014 | -- | $140,340 | $0 | $0 |
| 2011 | -- | $128,060 | $0 | $0 |
Source: Public Records
Map
Nearby Homes
- 5994 Glen Eagles Dr
- 6140 Pontiac Trail
- 000 Pontiac Trail
- 6100 Pontiac Trail
- 7545/7585 Pontiac Trail
- 7585/7548 Pontiac Trail
- 4540 Rolling Pine Ct
- 6433 Walnut Lake Rd
- 4442 Borland St
- 6980 Hambro St
- 5676 Hillcrest Cir E
- 5608 Hillcrest Cir W Unit 80
- 6606 Leytonstone Blvd
- VL Leytonstone Blvd
- 6675 Langtoft St
- 5160 Greenbriar Dr
- 5616 Hillcrest Cir W
- 0000 Langtoft
- 4066 Green Lake Rd
- 7065 Deerwood Trail Unit 27
- 6223 Lynn Ct Unit 21
- 6217 Lynn Ct
- 6229 Lynn Ct
- 4717 Woodbine Cir
- 6211 Lynn Ct Unit 23
- 6233 Lynn Ct Unit 19
- 6226 Lynn Ct
- 4723 Woodbine Cir
- 4715 Woodbine Cir
- 4728 Woodbine Cir
- 6237 Lynn Ct
- 6232 Lynn Ct
- 4727 Woodbine Cir
- 4709 Woodbine Cir
- 4722 Woodbine Cir
- 4734 Woodbine Cir
- 4733 Woodbine Cir Unit 12
- 4703 Woodbine Cir
- 6241 Lynn Ct Unit 1
- 4730 Oak Grove Ct Unit 3