Estimated Value: $199,000 - $237,728
3
Beds
1
Bath
1,056
Sq Ft
$207/Sq Ft
Est. Value
About This Home
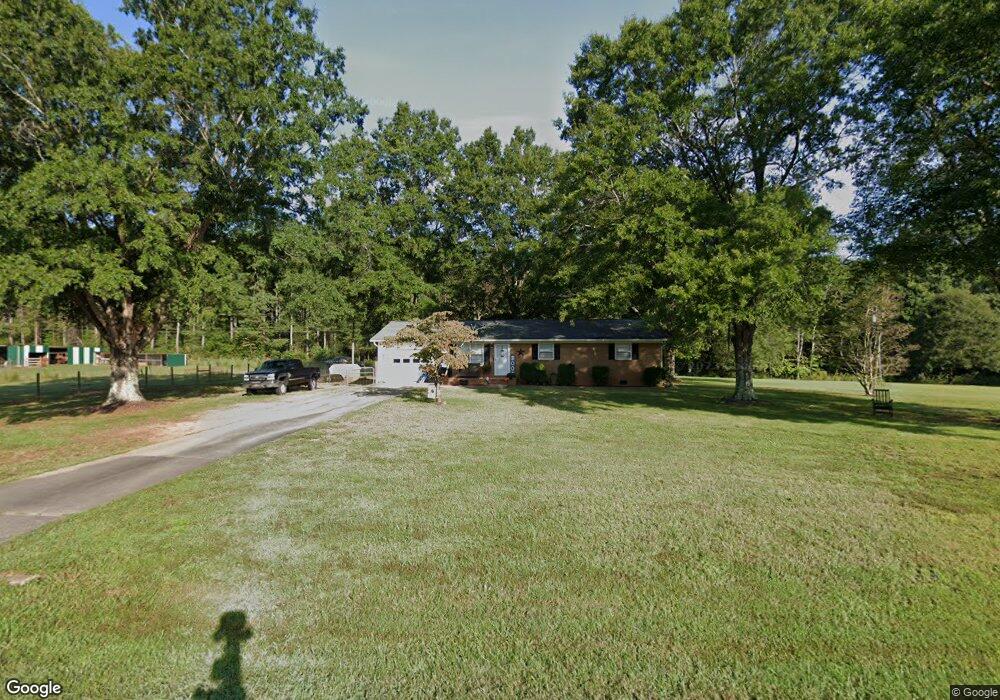
This home is located at 6224 Crowders Cir, Vale, NC 28168 and is currently estimated at $218,182, approximately $206 per square foot. 6224 Crowders Cir is a home located in Lincoln County with nearby schools including Union Elementary School, West Lincoln Middle, and West Lincoln High School.
Ownership History
Date
Name
Owned For
Owner Type
Purchase Details
Closed on
Sep 7, 2011
Sold by
Gray Brock and Gray Shelly Sharlene
Bought by
Henderson Joseph C and Pennington Brittany R
Current Estimated Value
Home Financials for this Owner
Home Financials are based on the most recent Mortgage that was taken out on this home.
Original Mortgage
$88,601
Outstanding Balance
$61,507
Interest Rate
4.55%
Mortgage Type
New Conventional
Estimated Equity
$156,675
Purchase Details
Closed on
Nov 24, 2010
Sold by
U S Bank National Association
Bought by
Gray Brock
Purchase Details
Closed on
Sep 23, 2010
Sold by
Maiale Thomas P
Bought by
U S Bank National Association
Purchase Details
Closed on
Dec 14, 2005
Sold by
Fredell Marjorie and Fredell Manuel
Bought by
Maiale Thomas P
Home Financials for this Owner
Home Financials are based on the most recent Mortgage that was taken out on this home.
Original Mortgage
$16,000
Interest Rate
6.29%
Mortgage Type
Seller Take Back
Create a Home Valuation Report for This Property
The Home Valuation Report is an in-depth analysis detailing your home's value as well as a comparison with similar homes in the area
Home Values in the Area
Average Home Value in this Area
Purchase History
| Date | Buyer | Sale Price | Title Company |
|---|---|---|---|
| Henderson Joseph C | $85,500 | None Available | |
| Gray Brock | $32,500 | None Available | |
| U S Bank National Association | $81,022 | None Available | |
| Maiale Thomas P | $80,000 | None Available |
Source: Public Records
Mortgage History
| Date | Status | Borrower | Loan Amount |
|---|---|---|---|
| Open | Henderson Joseph C | $88,601 | |
| Previous Owner | Maiale Thomas P | $16,000 |
Source: Public Records
Tax History Compared to Growth
Tax History
| Year | Tax Paid | Tax Assessment Tax Assessment Total Assessment is a certain percentage of the fair market value that is determined by local assessors to be the total taxable value of land and additions on the property. | Land | Improvement |
|---|---|---|---|---|
| 2025 | $1,201 | $170,033 | $28,823 | $141,210 |
| 2024 | $1,181 | $170,033 | $28,823 | $141,210 |
| 2023 | $1,176 | $170,033 | $28,823 | $141,210 |
| 2022 | $930 | $109,516 | $23,857 | $85,659 |
| 2021 | $930 | $109,516 | $23,857 | $85,659 |
| 2020 | $793 | $109,516 | $23,857 | $85,659 |
| 2019 | $793 | $109,516 | $23,857 | $85,659 |
| 2018 | $752 | $88,504 | $20,185 | $68,319 |
| 2017 | $651 | $88,504 | $20,185 | $68,319 |
| 2016 | $620 | $88,504 | $20,185 | $68,319 |
| 2015 | $694 | $88,504 | $20,185 | $68,319 |
| 2014 | $652 | $84,627 | $21,164 | $63,463 |
Source: Public Records
Map
Nearby Homes
- 7058 Sparrow Ln
- Lot 35 Sparrow Ln Unit 35
- 7190 Sparrow Ln
- 2486 Ridge Run Ln
- 5955 Reepsville Rd
- 5384 Reepsville Rd
- 000 Wells Rd
- 5298 Hoover Elmore Rd
- 5958 Hoover Elmore Rd
- 00 Sam Houser Rd
- 3243 Wilson Ct Unit 11
- 7392 Reeps Grove Church Rd
- 000 Knottywood Ln
- 5873 Alexis Ln
- 5436 N Carolina 27
- 448 Dave Peterson Ln
- 4318 Katie Reep Ln
- 1551 J Rhyne Reep Rd
- 3579 June Bug Rd
- 00 Bud Davis Rd
- 6214 Crowders Cir
- 6221 Crowders Cir
- 6258 Crowders Cir
- 6205 Crowders Cir
- 6235 Crowders Cir
- 6251 Crowders Cir
- 6272 Crowders Cir
- 6267 Crowders Cir
- 6085 Doral Ln
- 6113 Doral Ln
- 6290 Crowders Cir
- 6283 Crowders Cir
- 39 Sparrow Ln Unit 39
- 7077 Sparrow Ln Unit 38
- 7155 Sparrow Ln
- 0 Sparrow Ln Unit 3048932
- 0 Sparrow Ln Unit CAR4168469
- 7155 Sparrow Ln
- 27 Sparrow Ln Unit 27
- 7069 Sparrow Ln