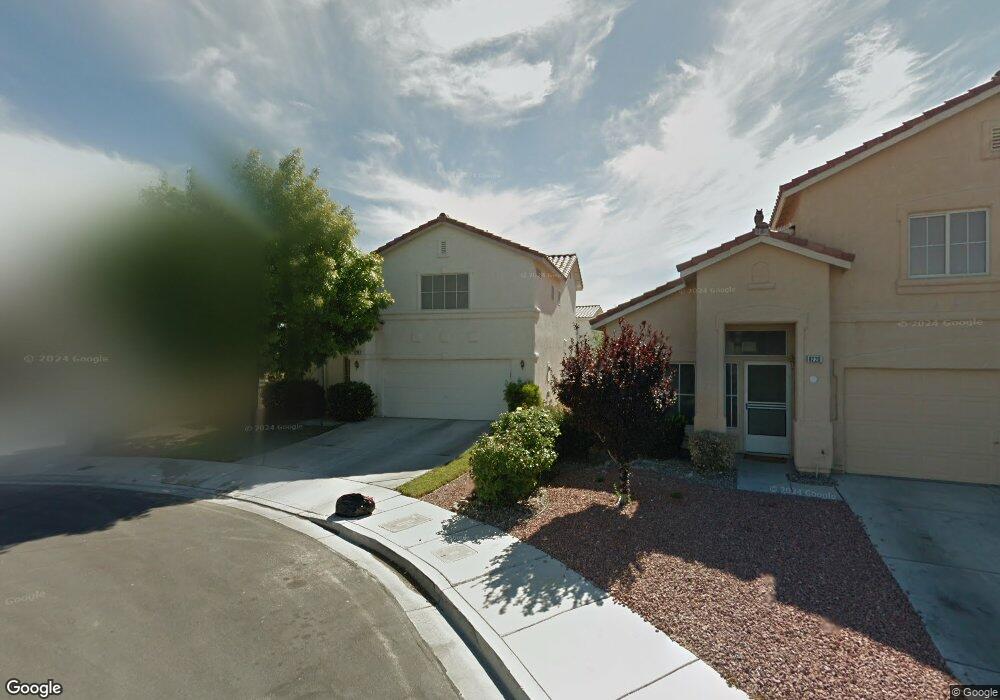
6224 Valley Grove Ct Unit 1 Las Vegas, NV 89130
North Cheyenne NeighborhoodEstimated Value: $406,000 - $439,000
4
Beds
3
Baths
1,842
Sq Ft
$228/Sq Ft
Est. Value
About This Home
This home is located at 6224 Valley Grove Ct Unit 1, Las Vegas, NV 89130 and is currently estimated at $419,175, approximately $227 per square foot. 6224 Valley Grove Ct Unit 1 is a home located in Clark County with nearby schools including Kay Carl Elementary School, Anthony Saville Middle School, and Shadow Ridge High School.
Ownership History
Date
Name
Owned For
Owner Type
Purchase Details
Closed on
Sep 15, 2003
Sold by
Singh Parvinder T and Kaur Hema T
Bought by
Youngard Timothy and Youngard Dannse
Current Estimated Value
Home Financials for this Owner
Home Financials are based on the most recent Mortgage that was taken out on this home.
Original Mortgage
$140,400
Outstanding Balance
$64,818
Interest Rate
6.17%
Mortgage Type
Unknown
Estimated Equity
$354,357
Purchase Details
Closed on
Jul 8, 1999
Sold by
Meadow Ridge 45 Llc
Bought by
Singh Parvinder T and Kaur Hema T
Home Financials for this Owner
Home Financials are based on the most recent Mortgage that was taken out on this home.
Original Mortgage
$130,647
Interest Rate
7.64%
Mortgage Type
FHA
Create a Home Valuation Report for This Property
The Home Valuation Report is an in-depth analysis detailing your home's value as well as a comparison with similar homes in the area
Home Values in the Area
Average Home Value in this Area
Purchase History
| Date | Buyer | Sale Price | Title Company |
|---|---|---|---|
| Youngard Timothy | $175,500 | Fidelity National Title | |
| Singh Parvinder T | $132,500 | United Title |
Source: Public Records
Mortgage History
| Date | Status | Borrower | Loan Amount |
|---|---|---|---|
| Open | Youngard Timothy | $140,400 | |
| Previous Owner | Singh Parvinder T | $130,647 | |
| Closed | Youngard Timothy | $35,100 |
Source: Public Records
Tax History Compared to Growth
Tax History
| Year | Tax Paid | Tax Assessment Tax Assessment Total Assessment is a certain percentage of the fair market value that is determined by local assessors to be the total taxable value of land and additions on the property. | Land | Improvement |
|---|---|---|---|---|
| 2025 | $1,451 | $98,769 | $34,650 | $64,119 |
| 2024 | $1,409 | $98,769 | $34,650 | $64,119 |
| 2023 | $1,409 | $93,283 | $32,550 | $60,733 |
| 2022 | $1,368 | $79,062 | $23,450 | $55,612 |
| 2021 | $1,328 | $78,103 | $25,200 | $52,903 |
| 2020 | $1,287 | $75,642 | $23,100 | $52,542 |
| 2019 | $1,249 | $71,339 | $19,600 | $51,739 |
| 2018 | $1,213 | $64,933 | $15,400 | $49,533 |
| 2017 | $2,150 | $65,590 | $15,400 | $50,190 |
| 2016 | $1,150 | $56,667 | $9,450 | $47,217 |
| 2015 | $1,146 | $41,109 | $8,400 | $32,709 |
| 2014 | $1,113 | $32,935 | $5,250 | $27,685 |
Source: Public Records
Map
Nearby Homes
- 5305 Meadow Rock Ave
- 6324 Whispering Meadow Ct
- 5424 Eagle Claw Ave
- 6325 Monarch Creek St
- 6021 Winter Meadow St
- 6108 Shallow Springs St
- 6101 Crystal Talon St
- 5501 Wells Cathedral Ave
- 0 Leon Ave Unit 2629017
- 6489 Yellow Bells Ct
- 6493 Yellow Bells Ct
- 5112 Foggia Ave Unit 1
- 5933 Perfect View St
- 5433 Bridgehampton Ave
- 4650 Ranch House Rd Unit 86
- 4650 Ranch House Rd Unit 57
- 4650 Ranch House Rd Unit 143
- 4650 Ranch House Rd Unit 64
- 5840 McLennan Ranch Ave
- 5312 Bright Sky Ct
- 6220 Valley Grove Ct
- 6228 Valley Grove Ct
- 6329 Whispering Meadow Ct
- 6325 Whispering Meadow Ct Unit 2
- 6216 Valley Grove Ct
- 6232 Valley Grove Ct
- 6333 Whispering Meadow Ct Unit 2
- 6321 Whispering Meadow Ct
- 6317 Whispering Meadow Ct
- 6233 Valley Grove Ct Unit 1
- 5229 Fall Meadows Ave
- 5225 Fall Meadows Ave
- 5301 Fall Meadows Ave
- 5301 Fall Meadows Ave Unit 1
- 6337 Whispering Meadow Ct
- 6225 Valley Grove Ct
- 5221 Fall Meadows Ave
- 6221 Valley Grove Ct Unit 1
- 5305 Fall Meadows Ave
- 5217 Fall Meadows Ave