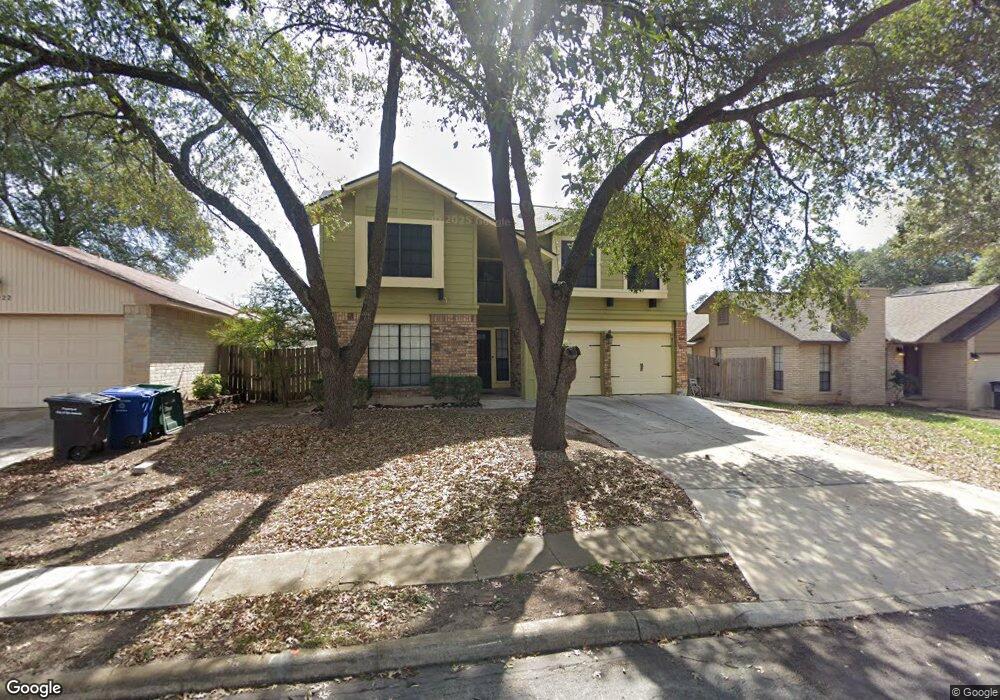
6226 Crab Orchard San Antonio, TX 78240
Estimated Value: $271,835 - $312,000
3
Beds
3
Baths
1,631
Sq Ft
$178/Sq Ft
Est. Value
About This Home
This home is located at 6226 Crab Orchard, San Antonio, TX 78240 and is currently estimated at $290,459, approximately $178 per square foot. 6226 Crab Orchard is a home located in Bexar County with nearby schools including Rhodes Elementary School, Neff Middle School, and John Marshall High School.
Ownership History
Date
Name
Owned For
Owner Type
Purchase Details
Closed on
Sep 4, 2009
Sold by
Casanova Belinda D
Bought by
Garcia Ann M
Current Estimated Value
Home Financials for this Owner
Home Financials are based on the most recent Mortgage that was taken out on this home.
Original Mortgage
$137,464
Outstanding Balance
$90,220
Interest Rate
5.26%
Mortgage Type
FHA
Estimated Equity
$200,239
Purchase Details
Closed on
Jun 12, 2006
Sold by
Bordner Craig James
Bought by
Casanova Belinda D
Home Financials for this Owner
Home Financials are based on the most recent Mortgage that was taken out on this home.
Original Mortgage
$119,225
Interest Rate
6.58%
Mortgage Type
Purchase Money Mortgage
Purchase Details
Closed on
Apr 9, 1997
Sold by
Lere Paul T and Lere Laura N
Bought by
Garrison Laura
Create a Home Valuation Report for This Property
The Home Valuation Report is an in-depth analysis detailing your home's value as well as a comparison with similar homes in the area
Home Values in the Area
Average Home Value in this Area
Purchase History
| Date | Buyer | Sale Price | Title Company |
|---|---|---|---|
| Garcia Ann M | -- | Fidelity National Title | |
| Casanova Belinda D | -- | Fidelity National Title | |
| Garrison Laura | -- | -- |
Source: Public Records
Mortgage History
| Date | Status | Borrower | Loan Amount |
|---|---|---|---|
| Open | Garcia Ann M | $137,464 | |
| Previous Owner | Casanova Belinda D | $119,225 |
Source: Public Records
Tax History Compared to Growth
Tax History
| Year | Tax Paid | Tax Assessment Tax Assessment Total Assessment is a certain percentage of the fair market value that is determined by local assessors to be the total taxable value of land and additions on the property. | Land | Improvement |
|---|---|---|---|---|
| 2025 | $4,588 | $272,080 | $76,450 | $195,630 |
| 2024 | $4,588 | $271,605 | $76,450 | $199,300 |
| 2023 | $4,588 | $246,914 | $76,450 | $207,860 |
| 2022 | $5,557 | $224,467 | $57,890 | $198,540 |
| 2021 | $5,231 | $204,061 | $47,290 | $159,550 |
| 2020 | $4,840 | $185,510 | $30,040 | $155,470 |
| 2019 | $4,841 | $180,710 | $30,040 | $150,670 |
| 2018 | $4,562 | $170,200 | $30,040 | $140,160 |
| 2017 | $4,499 | $167,547 | $30,040 | $142,000 |
| 2016 | $4,090 | $152,315 | $30,040 | $122,330 |
| 2015 | $3,189 | $138,468 | $24,320 | $118,120 |
| 2014 | $3,189 | $125,880 | $0 | $0 |
Source: Public Records
Map
Nearby Homes
- 5830 Gomer Pyle
- 6330 Crab Orchard
- 5831 Dan Duryea St
- 5822 Gomer Pyle
- 5822 Dan Duryea St
- 6323 Broadmeadow
- 7227 Trace Buckle Dr
- 6127 Walking Gait Dr
- 5634 Charlie Chan Dr
- 5914 Forest Mill St
- 6211 John Chapman
- 5723 Cary Grant Dr
- 6002 Forest Ledge St
- 6003 Broadmeadow
- 6050 Broadmeadow
- 6227 Lantern Creek
- 7107 Stirrup Cir
- 5810 Rue Bourbon
- 7038 Forest Meadow St
- 5551 Painter Green
- 6222 Crab Orchard
- 6302 Crab Orchard
- 6218 Crab Orchard
- 6306 Crab Orchard
- 6227 Crab Orchard
- 6303 Crab Orchard
- 6214 Crab Orchard
- 7115 George Burns St
- 6223 Crab Orchard
- 7119 George Burns St
- 6307 Crab Orchard
- 7111 George Burns St
- 6219 Crab Orchard
- 7123 George Burns St
- 6311 Crab Orchard
- 6210 Crab Orchard
- 6314 Crab Orchard
- 7107 George Burns St
- 6215 Crab Orchard
- 6315 Crab Orchard